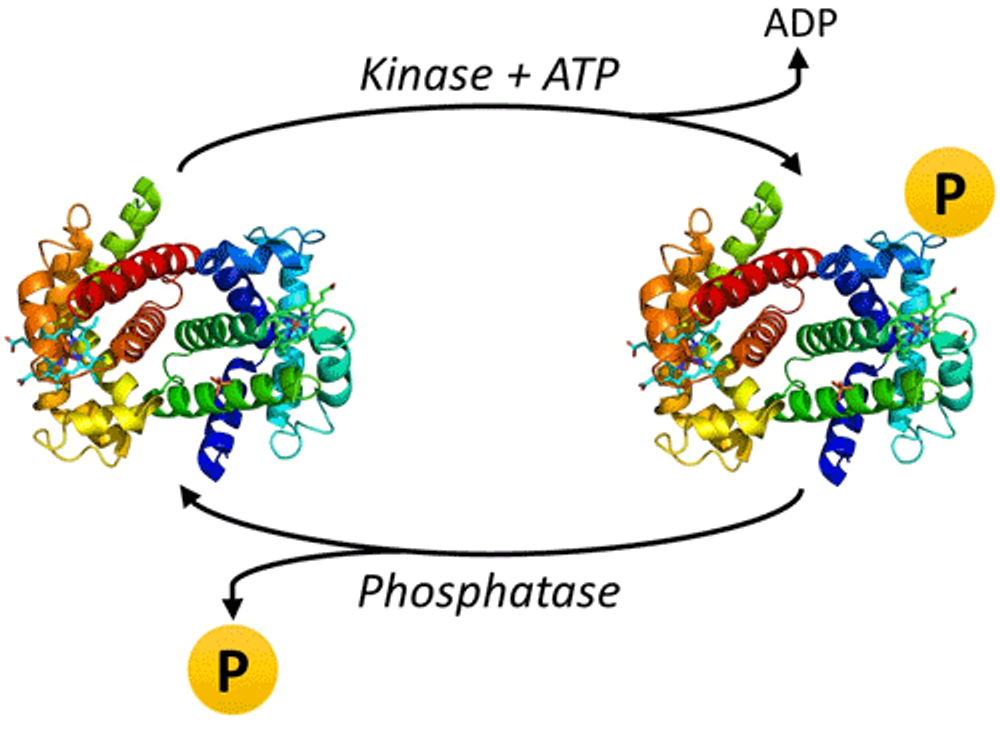
Protein phosphorylation is the most well-studied post translational modification (PTM), in which a phosphoryl group from adenosine triphosphate (ATP) is covalently attached to a serine (~86%), threonine (~12%), or tyrosine (~2%) by a kinase and removed by a phosphatase (Figure 1). [1] Phosphorylation at other amino acids have also been reported. [2] Phosphorylation can modify protein structure, function, and interactions. As such, phosphorylation plays a critical role in virtually all cellular processes in homeostasis and disease, including signal transduction, cell cycle, differentiation, proliferation, metabolism, motility, and death. [3,4] Importantly, phosphorylation at different residues can cause different outcomes. For example, RAF1 is a kinase central to the MAPK pathway that is activated when it is phosphorylated at serine (S) or threonine (T) residues S259, S338, S340/341, T491, or S494. [5,6] However, phosphorylation at S289/296/301 results in the inhibition of RAF1 kinase activity. [7] Understanding the specific sites and level of phosphorylation is paramount in understanding cell signaling and phenotype. In this blog, seven research tools for studying protein phosphorylation are discussed and compared.
Figure 1. Addition and removal of protein phosphorylation via kinases and phosphatases.
Sodium Dodecyl Sulfate Polyacrylamide Gel Electrophoresis (SDS-PAGE)
Proteins in a sample – often cell or tissue lysates – are first separated by size using SDS-PAGE. This is possible because the negatively-charged SDS in the buffer and gel applies a negative charge to all amino acids uniformly, enabling the separation of the proteins in an electric field based on size rather than by their unique amino acid content and charge (Figure 2A). [8] Proteins can then be visualized with Coomassie blue or silver staining. Notably, SDS-PAGE with Coomassie blue or silver staining can be used to detect some phosphorylation events that cause proteins to migrate slower than their unphosphorylated counterparts. A clear disadvantage to this approach is that migration shifts due to other factors (e.g., glycosylation) cannot be eliminated. Since all proteins will be stained with this approach, the analysis of purified proteins is primarily performed. Including the appropriate controls is an important consideration (see "Experimental Controls" box).
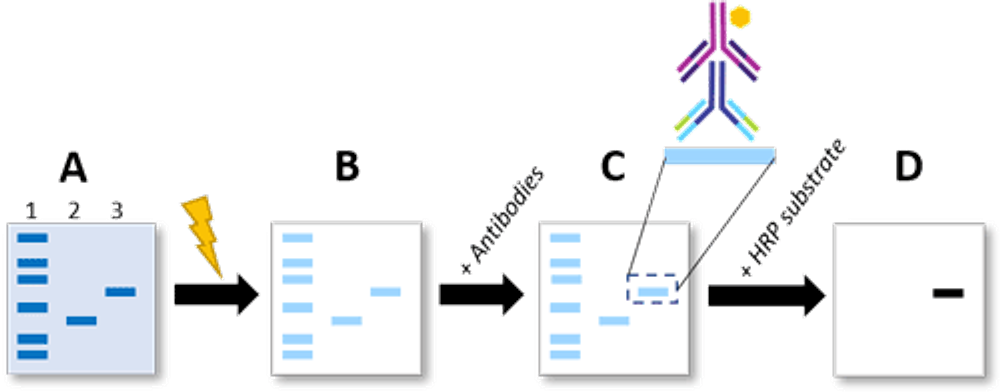
Figure 2. Western blotting procedure to detect phosphorylated proteins. A) Proteins are separated via SDS-PAGE where lane 1 = protein ladder, lane 2 = unphosphorylated protein, and lane 3 = phosphorylated protein. B) Proteins are transferred to a membrane via voltage. C) The membrane is incubated with an antibody specific to the phosphorylated site-of-interest and then an HRP-conjugated secondary antibody. D) After an HRP substrate is added, antibody binding (to the band representing the phosphorylated protein) is detected via chemiluminescence.
Experimental Controls
Including the right controls is essential to every well-performed experiment, and phosphorylation studies are no different. Important controls to consider include:
Expression level of a housekeeping gene (e.g., GAPDH, beta-actin) to ensure that the same amount of protein is added to each well of an SDS-PAGE gel (loading control for western blotting).
Expression level of the total protein (i.e., both phosphorylated and unphosphorylated protein). This will help determine whether protein phosphorylation or expression of the protein is up- or down-regulated.
Phosphorylated peptide or protein with phosphorylation at a specific site (positive control). Peptides can be synthesized chemically. Phosphorylated proteins may be obtained 1) with in vitro phosphorylation by mixing a kinase with known activity with the protein-of-interest, or 2) by stimulating cells with known effect on the protein-of-interest.
Unphosphorylated peptide or protein (negative control). In vitro kinase assays can either be performed without ATP or the phosphorylated proteins can be de-phosphorylated using phosphatases, such as lambda protein phosphatase. For cell culture experiments, an unphosphorylated control may be obtained with cells that have 1) not been stimulated or 2) been treated with a specific kinase inhibitor.
Unlabeled cells to determine gating parameters (negative control for flow cytometry)
Isotype control to determine gating parameters. An isotype control is an antibody with the same fluorophore, but not specific to the protein-of-interest (negative control for flow cytometry)
Please note that the types of controls may vary based on the research tool that is employed. Additional controls not listed above may be necessary.
A more traditional approach to detect phosphorylated proteins using SDS-PAGE employs radio-labeled ATP during kinase reactions. The phosphorylated protein is then detected via its incorporated radio-labeled ATP with autoradiography, fluorography, or phosphor imaging. [8] Unlike Coomassie or silver staining, the use of radio-labeled ATP enables the specific detection of unpurified phosphorylated proteins. Unfortunately, the radioactive label may not be amenable for all phosphorylation events and it poses health hazards. Alternatives to using radio-labeled ATP to detect phosphorylated proteins include staining with methyl green after phosphoester bond hydrolysis, using a fluorescent dye that specifically binds to phosphoryl groups (e.g., Pro-Q Diamond), or using metal chelation to conjugate a dye to the phosphoryl group. [9] For example, Phos-Tag™ is a dinuclear metal complex that binds strongly to the phosphoryl group at neutral pH. [10] Phos-Tag™ is precast into a gel and significantly inhibits the migration of phosphorylated proteins regardless of the phosphorylation site. Thus, any phosphorylation will result in a slower migration than the unphosphorylated protein, and a protein with several phosphorylation events may result in multiple bands that are easily discerned from one another. Purified proteins can be analyzed using Coomassie or silver staining, whereas unpurified proteins can be analyzed with western blotting (see next section). Phos-Tag™ can be used in conjunction with other applications (e.g., western blotting, mass spectrometry) to detect phosphorylated proteins.
Relative differences in band intensities across different sample treatments with SDS-PAGE are compared by eye, but densitometry signal can be extracted to obtain semi-quantitative data. Quantitative data is possible with SDS-PAGE analysis using a standard curve, but is not usually performed. [11]
Advantages:
Easy to perform
Uses very common laboratory equipment (white light detector)
Requires low to moderate skill
Phos-Tag™: Slower migration pattern for all phosphorylation events, flexible use across different applications
Simple data interpretation
Antibody-independent
Disadvantages:
Radio-labeled ATP: health hazards; requires autoradiography, fluorography, or phosphor imaging
Coomassie or silver staining: many phosphorylation events do not result in visibly slower migrations compared to unphosphorylated proteins
Differentiation between different protein isoforms may not be possible
Not quantitative
Low throughput
Specific site of phosphorylation cannot be ascertained
Western blotting
Western blotting is the gold standard for measuring phosphorylation levels qualitatively. After separating proteins via SDS-PAGE, the proteins are transferred from the gel onto a membrane when voltage is applied (Figure 2). [12] An antibody specific to the phosphorylation-of-interest is added to the membrane. The phosphorylation antibody is then bound by a secondary antibody conjugated to horseradish peroxidase (HRP). Antibody binding is detected when an HRP substrate is added, resulting in chemiluminescence.
Western blot sensitivity and specificity are dependent on the antibodies that are employed (see "Phosphorylation Antibodies" box). Should the antibody bind non-specifically to other proteins in the sample, the protein’s molecular weight and migration pattern compared to a protein ladder can often help determine which band is the protein-of-interest. This may be problematic, however, if the antibody binds to multiple protein isoforms with similar weights. As mentioned previously, phosphorylated proteins may migrate differently than expected.
Phosphorylation Antibodies
Many methods for detecting protein phosphorylation rely on antibodies, thus the specificity and sensitivity of these immunoassays are largely dependent on the specificity and sensitivity of the antibodies that are employed. One major disadvantage of these methods is that only phosphorylated proteins with corresponding antibodies can be detected. Unfortunately, producing good antibodies to phosphorylated proteins using traditional hybridoma methods do not have a high success rate and require extensive screening. [13] Rapid identification of rare plasma cells specific to phosphorylated antigens is possible with fluorescence-activated cell sorting (FACS). Alternatively, combining both immunization with phage display has helped isolate phospho-specific antibodies. [14] It is worth mentioning that detection of serine and threonine phosphorylation uses antibodies that target the specific amino acid sequence surrounding the phosphorylation site; there are no good "pan" phospho-serine or threonine antibodies on the market. Antibodies to pan-tyrosine (Y) phosphorylation (i.e., sequence-independent) are available, yet these also display binding preferences and may not bind to the specific phosphorylated tyrosine site of interest. [15]
Relative differences in band intensities across different sample treatments with western blotting are compared by eye, but densitometry signal can be extracted to obtain semi-quantitative data. Fluorescence-based western blotting uses a fluorescently-conjugated detection antibody, and is a preferred approach for quantitative analysis and the simultaneous detection of multiple proteins simultaneously. [16] Phosphorylation studies that employ western blotting should include, at a minimum, the expression level analyses of a housekeeping gene, phosphorylated protein, and total protein (see "Experimental Controls" box).
Advantages:
Popular / gold standard
Uses very common laboratory equipment (chemiluminescent detector)
Requires moderate skill
Simple data interpretation
Specific site of phosphorylation can be identified
Can be quantitative if the purified phosphorylated protein is available (not common)
Disadvantages:
Single-plex protein detection
Traditionally requires takes 1 – 2 days. However, shorter options are available. For example, Bio-Rad offers the Trans-Blot® Turbo™ Transfer system, which can decrease the gel-to-membrane transfer time from 1 hour to 7 minutes. [17] Another method is immunoprobing, in which the SDS-PAGE gel is encapsulated as a capillary system. [18] No gel transfer is necessary, thus resulting in a faster turnaround time and less need for troubleshooting (due to the decreased number of steps) than traditional western blotting.
Optimization and troubleshooting are often necessary (e.g., length of antibody incubation, finding the right antibody, using the right blocking reagent).
Not quantitative (usually)
Differentiation between different protein isoforms may not be possible (depends on antibody)
Low throughput
Antibody-dependent
Flow Cytometry
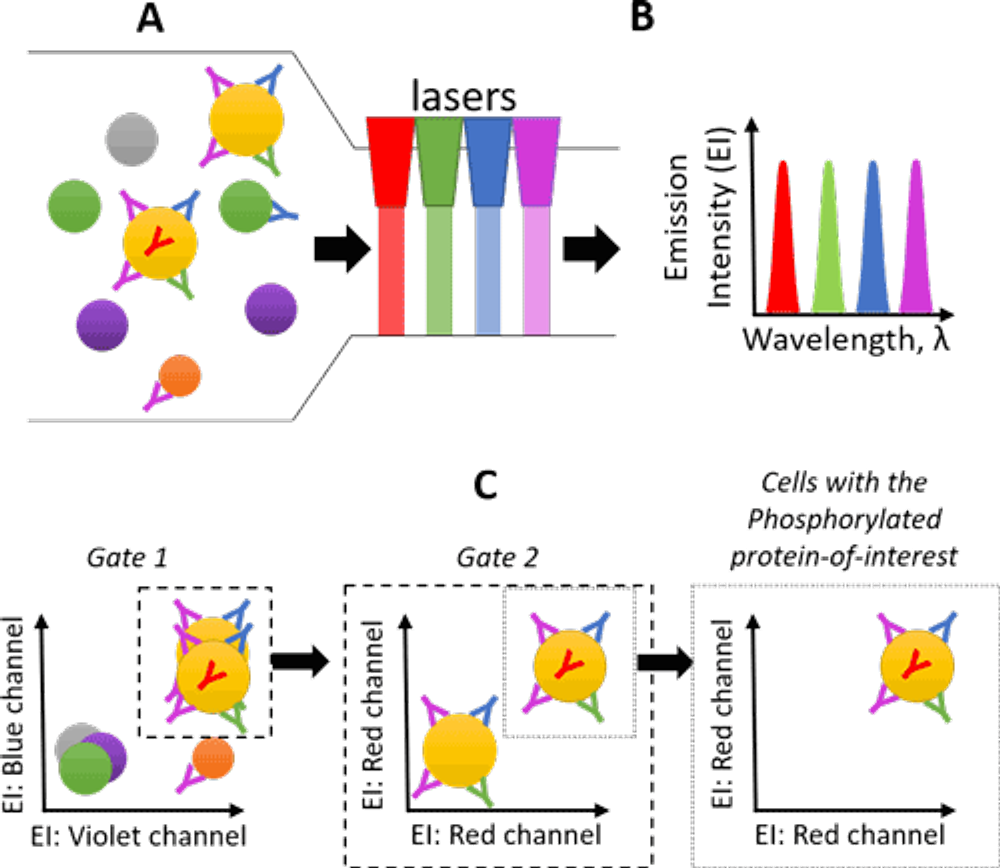
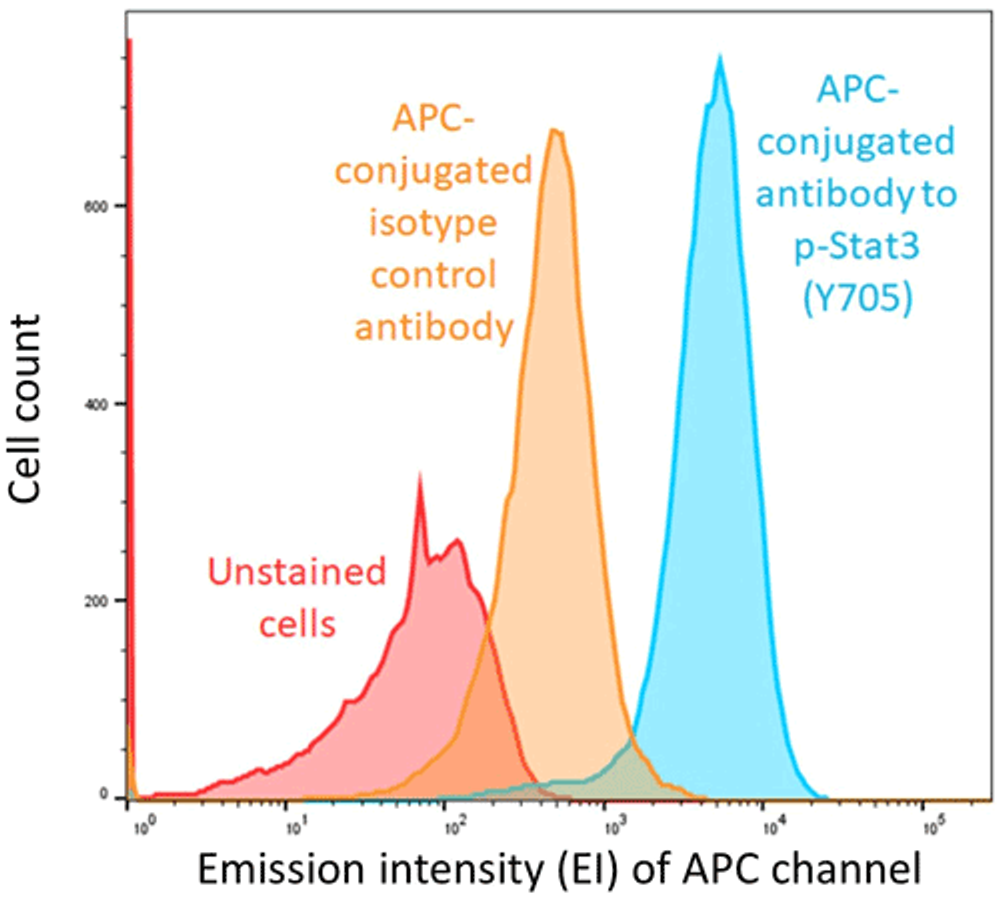
Flow cytometry is a liquid- based method in which single cells are characterized using fluorescently-conjugated antibodies targeting specific proteins-of-interest (Figure 3). [19] Cell viability can also be measured. The acquired mean fluorescence intensity (MFI) of the antibody fluorophore is proportional to the number of proteins-of-interest; thus, the higher MFI, the higher level of antigen. Flow cytometry is primarily used to detect cell surface proteins; however, intracellular proteins like phosphorylated proteins can also be analyzed. Unstained cells, or cells that are stained with the same fluorophore-conjugated control antibody, should be used as a negative control to help determine the autofluorescence and non-specific binding of the selected antibodies (Figure 4). Another negative control is the "isotype control," in which cells are stained with an antibody that does target the protein-of-interest. The isotype control ensures that the MFI of the phospho-antibody is specific for the phosphorylated protein-of-interest rather than an artefact. Accurate cell counts and relative fold changes are obtained with flow cytometry.
Figure 3. Schematic of the flow cytometry process. A) Cells representing different cell types are incubated with fluorescently-conjugated antibodies targeting proteins-of-interest. Each different antibody has a specific fluorophore. Y = antibody, where the differently-colored antibodies represent different fluorophores. B) The flow cytometer uses lasers to interrogate the cell size, shape, and fluorescence emission intensity (EI) of each cell. C) The cell population-of-interest can be selected with the correct combination of fluorophores (“gating”). Using this strategy, cells-of-interest can be counted and characterized.
Figure 4. Histogram of cell counts with emission in the allophycocyanin (APC) fluorescence
Advantages:
Multiplex protein detection
Cell population characterization
Cell viability can be measured
Uses common laboratory equipment (flow cytometer)
High throughput if using a 96-well plate sampler
Disadvantages:
Requires specialized training
Differentiation between different protein isoforms may not be possible (depends on antibody)
Not quantitative
Antibody-dependent
Kinase activity assays
Kinase activity can be determined with an in vitro kinase activity assay, in which a purified kinase and an unphosphorylated substrate are mixed together with radiolabeled ATP. [20] The substrate is subsequently analyzed for phosphorylation via the radiolabeled phosphoryl group. The scintillation count is proportional to the amount of phosphorylated substrate. Other in vitro kinase assays do not use radiolabeled ATP, but employ a detection antibody specific to the ADP (e.g., Adapta™) or phosphorylated site-of-interest (e.g., LANCE®). Yet another variation on a theme is time-resolved fluorescent resonance energy transfer (TR-FRET), which uses a fluorescent ATP molecule called a "tracer" and a paired fluorescently-tagged anti-kinase antibody. [21] In the absence of a substrate, the antibody and tracer will produce TR-FRET signal. As the kinase phosphorylates the substrate more with the ATP tracer, the TR-FRET signal will decrease. This research method is typically used by drug developers to identify new kinase substrates or to screen small molecule kinase inhibitors.
Advantages:
High throughput screening
Excellent platform for drug discovery and screening
Disadvantages:
Radio-labeled ATP: health hazards; requires autoradiography, fluorography, or phosphor imaging
Antibodies may be necessary to purify or detect the proteins-of-interest
In vitro results do not always represent activity in vivo
Enzyme-Linked Immunosorbent Assay (ELISA)
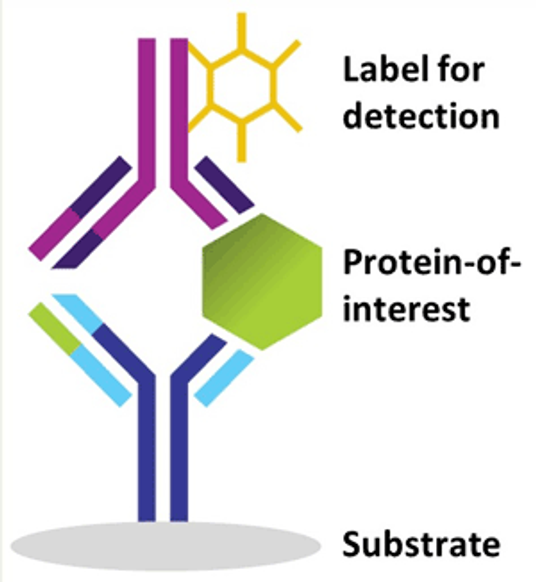
Traditional sandwich-based ELISA uses two antibodies to detect the protein-of-interest: one antibody captures the protein-of-interest while another antibody is used to detect it (Figure 5) (see "Sandwich Immunoassays: Finding the Right Antibody Pair" box). [23] To detect a phosphorylated protein with ELISA, one antibody binds total protein while the other binds the phosphorylation site; the best capture/detection configuration must be determined empirically by the ELISA developer (see "Experimental Controls" box). Briefly, the capture antibody that is immobilized onto a 96-well plate binds to the protein-of-interest when sample is applied. The subsequent binding of an HRP-conjugated detection antibody results in the protein-of-interest being "sandwiched" between the two antibodies. A blue color is produced when the HRP reacts with its added substrate, and this reaction is stopped with the addition of sulfuric acid, which turns the color from yellow to blue. The level of absorbance (i.e., optical density, OD) at 450 nm is proportional to the amount of detected protein-of-interest.
Figure 5. Sandwich immunoassay configuration
Sandwich Immunoassays: Finding the Right Antibody Pair
Finding two antibodies that can be paired in a sandwich immunoassay may require extensive antibody screening. [22] The antibodies not only have to bind to separate regions (or epitopes) on the same protein, but the epitopes must be accessible for binding on the platform. In some instances, two antibodies may not work as a capture-detection pair, but rather in a detection-capture configuration.
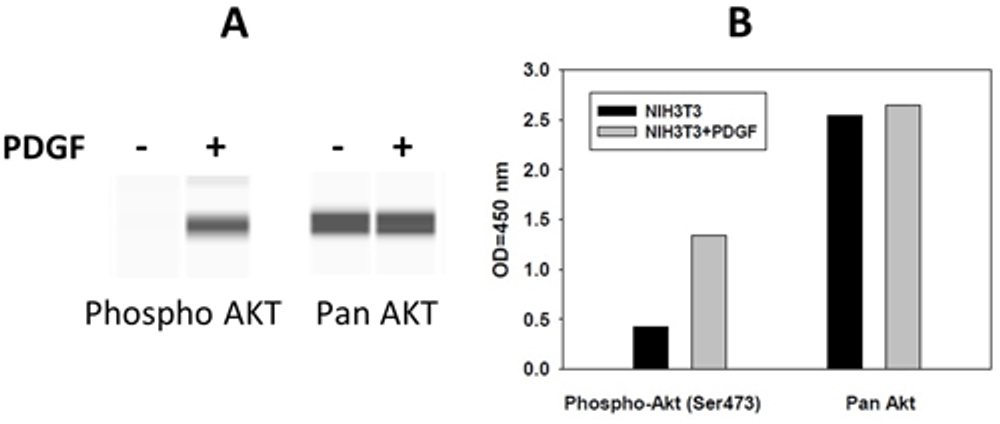
The concentration of the protein-of-interest is ascertained with a standard curve, which is produced by adding known amounts of purified target. While traditional ELISAs are quantitative, most phosphorylation ELISAs are semi-quantitative because they do not use a purified phosphorylated protein or peptide to create a standard curve. Rather, cell lysate that contains the phosphorylated protein-of-interest is used as a positive control to ascertain the linear OD range of the instrument; no standard curve is generated. Fortunately, more quantitative phosphorylation ELISAs are becoming commercially-available. A comparison of western blot and ELISA data is provided in Figure 6; the data are similar.
Figure 6. Comparison of results using A) immunoprobing and B) sandwich-based ELISA. NIH3T3 cells were grown to 80% confluency and then serum starved overnight. Cells were either untreated or treated with PDGFβ for 10 min, which did not increase the total amount of AKT but did increase the amount of phosphorylated AKT at serine 473.
ELISAs may be different than what is briefly described above. Plate-based ELISAs may utilize higher density plates. ELISAs may not even use a plate as a substrate, but a bead (e.g., SIMOA®). Cells may be cultured and their phosphorylated proteins analyzed using a cell-based ELISA. Competitive ELISAs only use a capture antibody, and because of this, they are considered to have lower specificity than sandwich ELISAs. [24]
Advantages:
Uses very common laboratory equipment (plate reader)
Requires low to moderate skill
High throughput (i.e., one phosphorylation site across many samples analyzed simultaneously)
Data collection usually completed in < 1 day
Simple data interpretation
Disadvantages:
Single-plex protein detection
Differentiation between different protein isoforms may not be possible (depends on antibody)
Most phosphorylation ELISAs are not quantitative
Antibody-dependent
Antibody Array
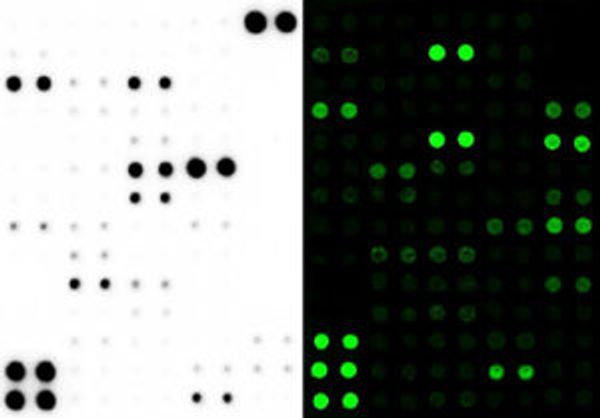
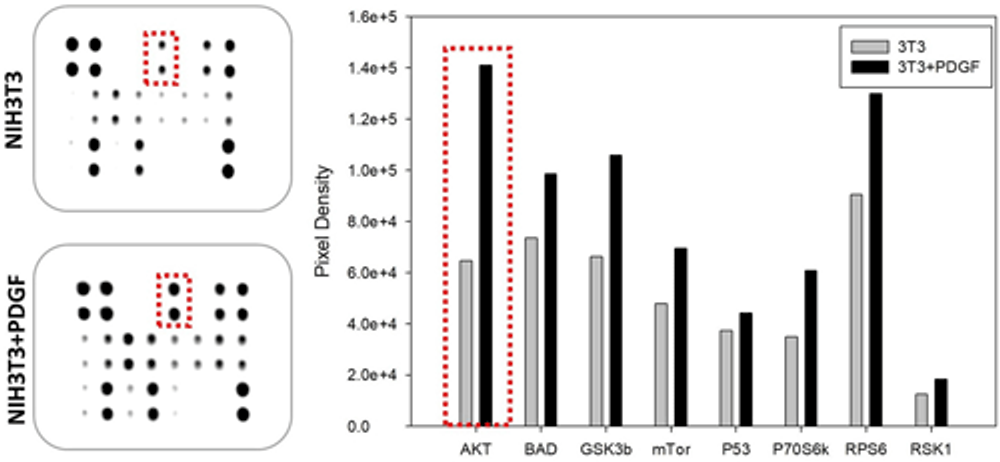
Multiplex detection of phosphorylated proteins is possible through the use of sandwich-based antibody arrays [see also "Enzyme-linked Immunosorbent Assay (ELISA)"], in which antibodies are immobilized on glass, membrane, or beads (Figures 6, 7). [25,26] After a blocking step, samples are incubated with the arrays. Nonspecific proteins are then washed off, and the arrays are incubated with detection antibodies, enabling chemiluminescent or fluorescent analysis. Signal is proportional to the amount of protein bound by the antibodies. Comparisons between western blotting, ELISA, and antibody array data (Figures 6, 8) show that all three methods reflect similar phosphorylation changes when NIH3T3 cells are treated with PDGFβ. While quantitative data can be obtained with antibody arrays, no quantitative arrays targeting phosphorylated proteins are commercially available. By spotting or labeling different antibodies in an addressable format, protein identification is simple. For more information on antibody arrays, please read our blog, "A Comparison of Antibody Arrays and Mass Spectrometry in Protein Profiling and Biomarker Research."
Figure 7. Antibody array images. (Top) Chemiluminescent detection of protein signal using a membrane-based array. (Bottom) Fluorescent detection of protein signal using a glass slide-based array.
Figure 8. Phosphorylation antibody array incubated with lysates of NIH3T3 cells either untreated or treated with PDGFβ. PDGFβ stimulation results in AKT phosphorylation (dotted red outline).
Advantages:
Multiplex protein detection (tens to thousands of different proteins analyzed simultaneously)
Membrane arrays use common laboratory equipment (chemiluminescent detector)
Multiple array platform options to select from
May require low to moderate skill depending on chosen array platform
Data collection usually completed in < 1 day
Simple data interpretation
Disadvantages:
May require uncommon laboratory equipment (glass arrays with a compatible laser scanner, bead-based arrays with a flow cytometer)
Low throughput (i.e., few to 100 samples analyzed at one time)
No quantitative data for phosphorylated protein detection
Data extraction of signal intensities requires specific software
Data extraction of signal intensities may be time-consuming depending on array density
Differentiation between different protein isoforms may not be possible
Antibody-dependent
Mass Spectrometry (MS)
In the common "bottom-up" MS approach, proteins are digested into peptides, which are then ionized prior to mass spectrometry analysis. Using a compiled peptide-to-protein database, each peptide is assigned to a protein based on its mass and fragmentation. Detection of low abundance proteins (e.g., phosphorylated proteins) can be masked by highly abundant proteins during the detection process. Thus, enrichment of phosphorylated peptides prior to MS analysis is routinely performed using phospho-specific antibodies or titanium dioxide. [27,28] Depending on the upstream sample preparation and matrix, more than 5,000 proteins can be identified with MS in a single analysis. Semi-quantitative (relative fold changes) and quantitative data (protein concentrations) can be obtained with MS regardless of the phosphorylation state.
MS has three distinct differences compared to western blots and ELISA. First, novel phosphorylation events can be identified because MS does not rely on antibodies. This type of analysis is considered "hypothesis-free" or "unbiased." Second, western blots and ELISA have a narrow dynamic range of 2 - 3 orders of magnitude whereas MS has a dynamic range up to 5 orders of magnitude, thus enabling the detection of phosphorylated proteins at lower concentrations. [29,30] Finally, protein isoforms can be easily distinguished from one another. For more information on mass spectrometry, please read our blog "A Comparison of Antibody Arrays and Mass Spectrometry in Protein Profiling and Biomarker Research."
Advantages:
Multiplex protein detection
Data collection usually completed in < 1 day
Antibody-independent (i.e., unbiased)
Large dynamic range
Ability to discern between different protein isoforms
High sensitivity
Quantitative data possible
Disadvantages:
Requires enrichment of phosphorylated proteins
Requires expensive and uncommon laboratory equipment (mass spectrometer)
Complex data interpretation requires specialized software
Operation of a mass spectrometer requires specialized training
Low throughput (i.e., few to tens of samples analyzed in < 1 day)
Conclusions
Studying protein phosphorylation is important in understanding cell signaling and phenotype. Here, we described seven methods to detect phosphorylated proteins: SDS-PAGE, western blots, flow cytometry, kinase activity assays, ELISA, antibody arrays, and MS. Identifying which method to use depends on the project’s objective, expertise, access to instruments, and budget. For example, a kinase activity assay would be used to screen the crossreactivity of a kinase inhibitor whereas a western blot would be appropriate to measure the level of a specific phosphorylated protein after cells are treated with a kinase inhibitor. If the downstream effect of a kinase inhibitor on protein phosphorylation was unknown, however, MS should be used. Notably, research labs that do not have the personnel, expertise, or equipment to perform these methods themselves can utilize commercially-available full testing services. Finally, the methods described herein either require phospho-specific antibodies or can use antibodies during sample processing. Thus, increased production of highly specific and sensitive phospho-antibodies is essential in advancing phospho-proteomics.
References
Ardito F, et al. The crucial role of protein phosphorylation in cell signaling and its use as targeted therapy (Review). Int J Mol Med. 2017 Aug;40(2):271-280.
Fuhs SR, Hunter T. pHisphorylation: the emergence of histidine phosphorylation as a reversible regulatory modification. Curr Opin Cell Biol. 2017 Apr;45:8-16
Ardito F, et al. The crucial role of protein phosphorylation in cell signaling and its use as targeted therapy (Review). Int J Mol Med. 2017 Aug;40(2):271-280.
Kurochkina N, et al. Phosphorylation, dephosphorylation, and multiprotein assemblies regulate dynamic behavior of neuronal cytoskeleton: a mini-review. Front Mol Neurosci. 2018 Oct 8;11:373.
Chong H and Guan K. Regulation of Raf through phosphorylation and N terminus-C terminus interaction. The Journal of Biological Chemistry. 2003; 278, 36269-36276.
Jaumot M and Hancock JF. Protein phosphatases 1 and 2A promote Raf-1 activation by regulating 14-3-3 interactions. Oncogene. 2001 Jul 5;20(30):3949-58.
Han S and Meier KE. Integrated modulation of phorbol ester-induced Raf activation in EL4 lymphoma cells. Cell Signal. 2009 May;21(5):793-800.
Kinoshita E, et al. Separation and detection of large phosphoproteins using Phos-tag SDS-PAGE. Nat Protoc. 2009;4(10):1513-21.
Gauci VJ, et al. Quantitative proteomics: assessing the spectrum of in-gel protein detection methods. J Chem Biol. 2011; 4:3–29.
Kinoshita E, et al.Recognition of phosphate monoester dianion by an alkoxide-bridged dinuclear zinc(II) complex. Dalton Trans., 2004; 1189-1193.
Brady PN and Macnaughtan MA. Evaluation of colorimetric assays for analyzing reductively methylated proteins: biases and mechanistic insights. Anal Biochem. 2015 December 15; 491: 43–51.
Bass JJ, et al. An overview of technical considerations for Western blotting applications to physiological research. Scand J Med Sci Sports. 2017 Jan; 27(1): 4–25.
Kurosawa N, et al. Novel method for high-throughput production of phosphorylation site-specific monoclonal antibodies. Scientific Reports. 2016; 6(25174).
Shih HH, et al. An ultra-specific avian antibody to phosphorylated tau protein reveals a unique mechanism for phosphoepitope recognition. The Journal of Biological Chemistry. 2012; 287, 44425-44434.
Lind J, et al. Systematic analysis of phosphotyrosine antibodies recognizing single phosphorylated EPIYA-motifs in CagA of East Asian-type Helicobacter pylori strains. BMC Microbiology. 2016; 16(201).
Kondo Y, et al. Sensitive detection of fluorescence in western blotting by merging images. PLoS One. 2018; 13(1): e0191532.
Silva JM and McMahon M. The fastest Western in town: a contemporary twist on the class Western blot analysis. J Vis Exp. 2014 Feb 5;(84):e51149.
Harris VM. Protein detection by Simple Western™ analysis. Methods Mol Biol. 2015;1312:465-8.
Krutzik PO, et al. Analysis of protein phosphorylation and cellular signaling events by flow cytometry: techniques and clinical applications. Clin Immunol. 2004 Mar;110(3):206-21.
Karra AS, et al. Assaying Protein Kinase Activity with Radiolabeled ATP. J Vis Exp. 2017; (123): 55504.
Lebakken CS, et al. Development and applications of a broad-coverage TR-FRET-based kinase binding assay platform. J Biomolecular Screening. 2009; 14(8): 924-935.
Kiening M, et al. Microplate-based screening methods for the efficient development of sandwich immunoassays. Analyst. 2005 Dec;130(12):1580-8.
Division of Malaria and Parasitic Diseases. World Health Organization. The enzyme-linked immunosorbent assay (ELISA). Bull World Health Organ. 1976; 54(2): 129–139.
Kingan TG. A competitive enzyme-linked immunosorbent assay: applications in the assay of peptides, steroids, and cyclic nucleotides. Anal Biochem. 1989 Dec;183(2):283-9.
Huang W, et al. Integration of antibody array technology into drug discovery and development. Assay Drug Dev Technol. 2018 Feb/Mar;16(2):74-95.
Huang W, et al. New insights into the tumor microenvironment utilizing protein array technology. Int J Mol Sci. 2018 Feb; 19(2): 559.
Wang MC, et al. Optimization of titanium dioxide and immunoaffinity-based enrichment procedures for tyrosine phosphopeptide using matrix-assisted laser desorption/ionization time-of-flight mass spectrometry. Anal Bioanal Chem. 2015 Feb;407(5):1343-56.
Stokes MP, et al. PTMScan direct: identification and quantification of peptides from critical signaling proteins by immunoaffinity enrichment coupled with LC-MS/MS. Mol Cell Proteomics. 2012 May;11(5):187-201.
Wilson R. Sensitivity and specificity: twin goals of proteomics assays. Can they be combined? Expert Review of Proteomics. 2013; 10:2, 135-149
Koopmans F, et al. Comparative analyses of data independent acquisition mass spectrometric approaches: DIA, WiSIM-DIA, and untargeted DIA. Proteomics. 2018 Jan; 18(1): 1700304.