Skip to navigationSkip to contentSkip to footer
Biostatistics and Bioinformatics
  • Home
  • CRO Services
  • Biostatistics and Bioinformatics

Bioinformatics Services

Array data must be analyzed with care to best identify differences between samples, but not everyone has the expertise or resources to properly process array data. Let our in-house biostatistics and bioinformatics experts analyze your data for you.

We can perform custom analyses for both genomics and proteomics data. For RayBiotech multiplex arrays, we offer á la carte options. We can also assist in experimental design. Click on a service below to learn more:

Tell us about your project and the type of analysis you need at techsupport@raybiotech.com. You can also call us at 770-720-2992 to quickly speak with a representative to help guide you.
Email the Experts

Core Bioinformatics & Biostatistics Services

Data Clean-Up
Differential Expression Analysis
Cluster Analysis
Pathway Analysis
Biomarker Selection
Experimental Design
Multiomics
Quantitative Proteomics
Discovery Proteomics

Data Clean-Up

We recommend the data clean-up service for all array data as it forms the foundation for all subsequent biostatistics and bioinformatics analysis. Your final report will contain the protein expression data after data filtration, normalization, transformation, and outlier extraction (Microsoft Excel format) in addition to a detailed description of analysis steps performed (PDF format).

Example Data Clean-Up Report

PCA_Outlier-Identification


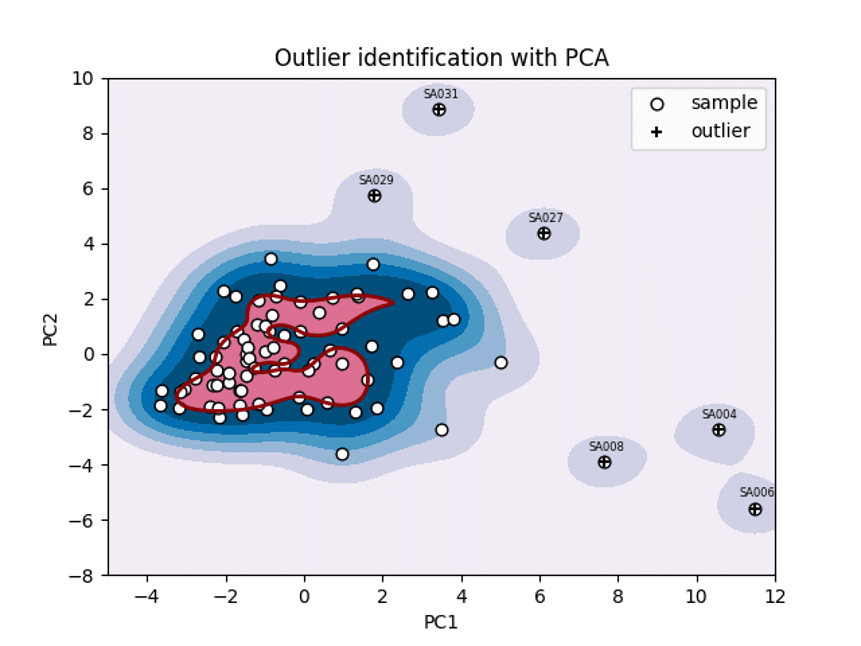
Outlier identification using Principal Component Analysis (PCA)


Differential Expression Analysis

This analysis identifies the proteins that are statistically significant between different groups of samples. This service is especially helpful for biomarker discovery / validation and profiling. The types of statistical analyses include:

  • T-test & ANOVA (Analysis of Variance)
  • Wilcoxon Rank-Sum
  • SAM (Significance Analysis of Microarray)

Your final report will contain the following information:

  • Description of analysis steps performed
  • Comparison of statistical tests
  • Result summary depicting p-values
  • Volcano Map
  • Jitter or swarm plot

Use to determine:

  • Potential side effect discovery
  • Exploration of drug molecular mechanisms
  • Bioprocessing residue identification
  • Biosimilar evaluation

Example Differential Expression Analysis Report


Differential-Expression-Analysis

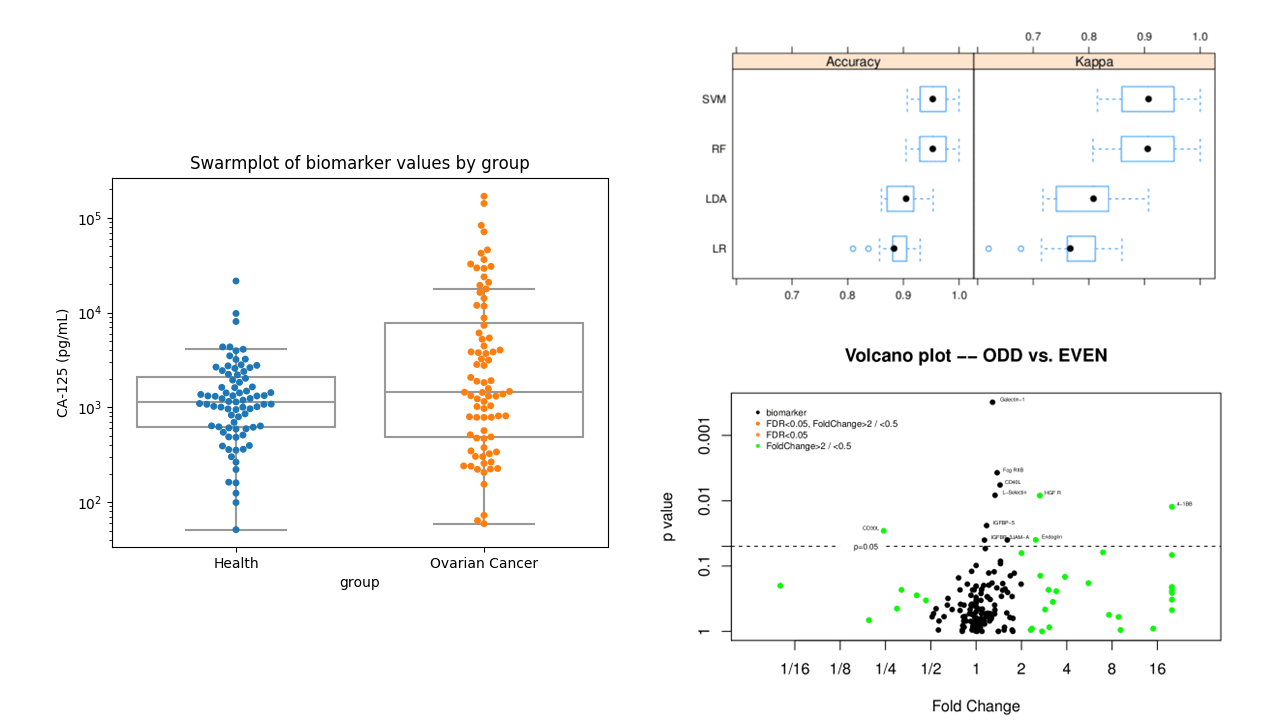
Jitter plot comparing sample groups for one biomarker candidate. Cross-validation and accuracy and kappa of biomarkers using different statistical tests. Volcano plot comparing sample groups.


Cluster Analysis

Cluster analysis identifies groups of markers with similar and different expression profiles across groups. This service is especially helpful for profiling and sample stratification. The final report includes:

  • Description of analysis steps performed
  • Hierarchical cluster
  • PCA plot

Example Cluster Analysis Report

Cluster-Analysis-Services

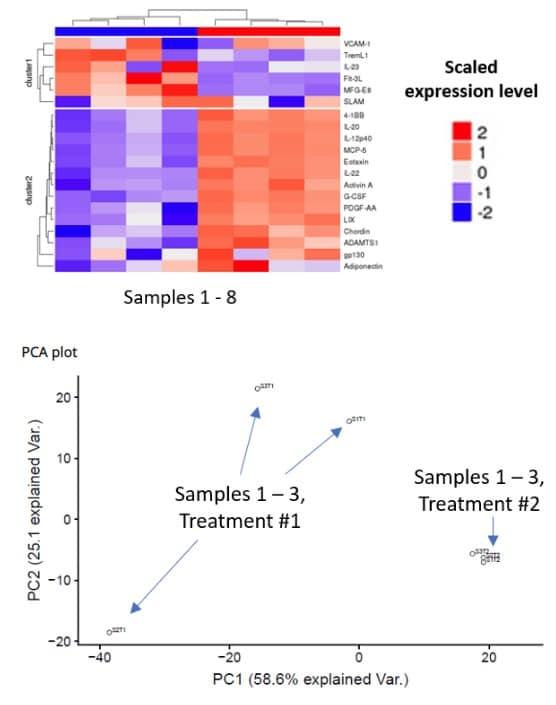
Hierarchical cluster and heatmap of 8 samples where red represents increased expression level and blue represents decreased expression level. Plot of PC1 and PC2 values of 6 samples. Samples subjected to Treatment #2 ("T2") cluster with each other but not with samples subjected to Treatment #1 ("T1"). Samples subjected to T1 do not cluster with each other.


Pathway Analysis

Pathway analysis identifies the specific protein functions, biological pathways, and physical interactions that are enriched in a particular group. The data are obtained from:

  • GO (Gene Ontology)
  • KEGG (Kyoto Encyclopedia of Genes and Genomes)
  • STRING

This service is used for profiling, sample stratification, and biomarker discovery. Your final report will contain the following information:

  • Description of analysis steps performed
  • Pathway enrichment
    • List of enriched pathways and FDR values
    • List of the proteins, their known functions and processes, and p-values related to their enrichment
    • Enriched biological pathways (see figure)
    • Enriched molecular functions
    • Enriched biological processes
  • Protein interaction mapping
    • List of proteins identified in your study that have known interactions with each other
    • Protein interaction map (see figure)

Example Pathway Analysis Report

Pathway-Analysis

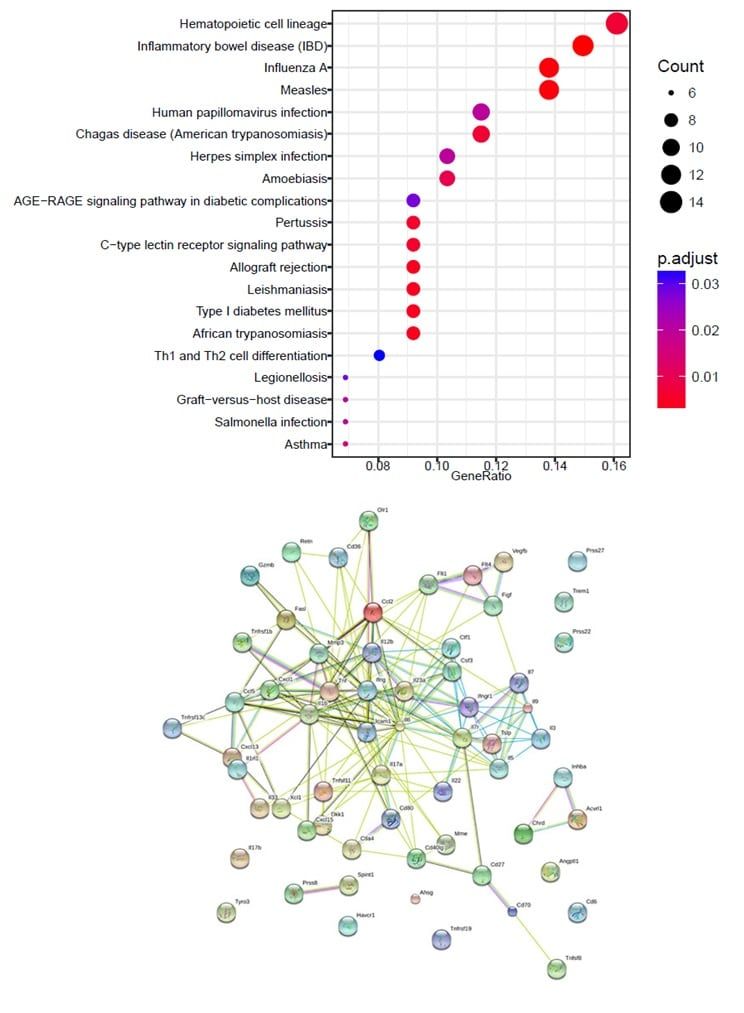
KEGG pathway over-representation analysis on differentially-expressed biomarkers (FDR < 0.05). Protein interaction map where proteins are represented as nodes and interactions as edges.


Biomarker Selection

Biomarker selection uses a variety of models to identify a subset of biomarkers that best differentiate the control from test samples. The models that are used in this service include:

  • Logistic regression
  • Linear discriminant analysis (LDA)
  • Support vector machine (SVM)
  • Random forest
  • Other models may be used

Your final report will contain the following information:

  • Description of analysis steps performed
  • Predictive modeling using a subset of data
  • ROC analysis


Example Biomarker Selection Report


Experimental Design

Before you begin an experiment. Don’t find out after you’ve collected your data that you didn’t design your experiment properly! RayBiotech’s team of technical experts will work with you to design your experiment so that you can obtain statistically-powerful array data. We consider such things as:

  • Replication
  • Randomization
  • Blocks
  • Sample size
  • Estimated biomarker prevalence
  • Sensitivity & specificity

What you get:

  • One-on-one consultation with a technical expert
  • Detailed experimental design report
  • Properly designed experiment so that statistically-powerful data can be obtained

Discuss your project requirements

Email our experts
FAQ

Frequently Asked Questions

Still have questions?

Contact Us

These prices are for array data using RayBiotech arrays. Minimum of $250 per order.

For pricing information on data collected using other companies' arrays, bulk service orders, custom packages, or custom analyses, please contact us.

* All data must go through pre-processing, which is known as our "Data clean-up" service. This package does NOT include Experimental Design.

** Up to 1500 targets. For more than 1500 targets per array, please contact us for pricing.

*** For example, biomarker discovery and validation are two different experiments.

This depends on the data analysis that we will perform.

If data from RayBiotech arrays will be analyzed with our Biostatistics & Bioinformatics service, the data must be provided in the correct format:

  • Analyzed with the Analysis Tool software. The Analysis Tool software is available for free to download on the array's product page. If you have difficulty locating the software, please e-mail info@raybiotech.com and provide the array catalog numbers that you used.
  • Normalized inter-array data. The Analysis Tool software normalizes data within a slide, but does not perform across-slide normalization. Learn more about normalizing array data on this page under "How do I normalize my array data?"
    RayBiotech can provide the correct data format for RayBiotech arrays as part of our array full testing services or array analysis services (additional fees apply).
    If other types of data will be analyzed, we will let you know what type of format we will require.

Click on a service below to view an example report:

  • Biomarker Selection
  • Cluster Analysis
  • Data Clean-Up
  • Differential Expression Analysis
  • Pathway Analysis

This step is important for a couple of reasons.

The first reason is that this service puts the data in a format that is required by the other services. In other words, if a dataset does NOT go through "Data clean-up", none of the other services can be performed.

The second reason is that variability within and across arrays is common with protein arrays, thus data normalization and transformation essentially improve the technical reproducibility. Outlier data can skew results. If this service is NOT used, it is highly probable that any potential differences between sample groups are not identified. Alternatively, differences that are detected may not be reliable (i.e., false positives).

We can identify biomarkers by their differential expression; enrichment of pathway, molecular function, biological process, and protein-protein interactions; and feature selection following predictive modeling.

It depends. We appreciate feedback and suggestions, and may implement your suggestions as part of our standard services. Some figures and analyses may be free depending on the selected package, number of samples and workload that it will take. Please contact us to find out.

For packages using only one service, our turnaround time is 5 - 7 business days. For the other packages including > 2 services, our turnaround time is 10 - 12 business days.

Once we receive all of the information that we need from you, our turnaround time is 5 - 7 business days.

We can. The format needs to be in .csv or Excel. The protein symbol or gene symbol must be listed by row. The sample must be listed by column. For these analyses, you will need to contact us for pricing.

We can do analyses on DNA data and the cost is dependent on several factors. We will need to know sample number, data quality, data size, and data type (i.e., how was it analyzed?). You also need to let us know exactly what type of information you're looking for, such as peak identity, peak annotation, sample comparison, etc. Our turnaround time is usually 2 - 3 weeks. Please contact us to learn more.

We often do, depending on the number of samples that will be analyzed. Please contact us to find out.

There is a required amount of time to set up the analyses per experiment, and it is one of the most labor-intensive steps of the process. Therefore, we need to charge a minimum amount to cover the labor required for setting up the analyses.

Yes, you can. If an Excel format of your report is not provided to you, just ask us for it.

The "Differential expression analysis", "Cluster analysis", and "Pathway analysis" services are interested in finding the statistical or biological relationship of a biomarker with the disease. The "Biomarker selection" service is interested in finding the combination of biomarkers that will classify or predict disease status.

"Data clean-up": 1 sample
"Pathway analysis": 1 sample per group
"Cluster analysis": 1 sample per group
"Differential expression analysis": 3 samples per group
"Biomarker selection": 10 samples per group

Per group refers to a condition to be tested. If healthy versus cancer samples are to be compared, these are two different groups and a minimum of 20 samples would be needed to perform the "Biomarker selection" service.

Low sample numbers for "Differential expression analysis" and "Biomarker selection" services will result in less accurate modeling. Researchers should try to use at least 10 samples per group for the "Differential expression analysis" service and at least 25 samples per group for the "Biomarker selection" service.

For a general, non-math understanding of how many of these analyses work, please click here.

Still have questions?

Contact Us

Related Services

Biomarker Discovery

The discovery of good biomarkers and their translation to the clinic is a challenging and multistep process, for which RayBiotech can provide expertise and a variety of tools to build a tailored solution.

Quantitative Proteomics Services

Ship us your samples and our experienced team will use our GLP-compliant Quantibody® Multiplex ELISA platform to quantitatively detect up to 1200 human, 640 mouse, 282 rat, 50 porcine, or 30 bovine proteins.

CRO Services

Our main laboratory in Atlanta has a high-complexity CLIA laboratory and is accredited by ANSI to ISO 17025:2017. In addition to clinical, we provide broad pre-clinical capabilities with a single provider.

Package Name

What you get

Per sample
with ≤ 500
targets

Per sample with
> 500 targets**

Catalog #

Basic

Data clean-up

$5

BIOSTAT-Pre-A

$8

BIOSTAT-Pre-B

Any 1*

Any ONE
service*
Includes data
clean-up

$10

BIOSTAT-1-A

$16

BIOSTAT-1-B

Any 2*

Any TWO
services*
Includes data
clean-up

$16

BIOSTAT-2-A

$25.60

BIOSTAT-2-B

Any 3*

Any THREE
services*
Includes data
clean-up

$21

BIOSTAT-3-A

$33.60

BIOSTAT-3-B

The Works

All 4 services*
Includes data
clean-up

$24

BIOSTAT-Works-A

$38.40

BIOSTAT-Works-B

Experimental Design

Experimental Design

$250 per experiment***

BIOSTAT-ED

Products
  • Multiplex Assays
  • ELISA Kits
  • Proteins and Peptides
  • Antibodies
  • Flow Cytometry
  • Assay Kits
  • Molecular Biology

Sign up to get promotions on your favorite research tools and research updates.

Sign up to Newsletter (opens in new tab)
Services
  • Multiplex Assay Services
  • ELISA Services
  • Antibody Services
  • Custom Protein Services
  • CRO Services
  • Flow Cytometry Services
  • Simoa – Single Molecule Array Services
Resources
  • Manual Protocols
  • Resource Library
©2007-2026 RayBiotech, Inc. All rights reserved.Life Science Web Design By Supreme
  • Privacy Policy
  • Terms & Conditions
  • ISO Certification
  • Risk Free Guarantee
  • Promotions
  • Learning Center
  • Array Analysis Tools
  • Publications / Citations
  • Publications by RayBiotech Scientists
  • About Us
    • About RayBiotech
    • Careers
    • Quality Systems
    • Business Partnerships
    • News & Events
    • Reducing Our Emissions
    Contact Us
    • Contacts
    • Distributors
    • Certified Service Providers
    ISO 13485:2016cGMP
    ISO 17025:2017CLIA
    Need Help?770-729-2992
    MY ACCOUNT

    Your cart is empty.

    RayBiotech
    RayBiotech
    • Products
      • Multiplex Assays
      • ELISA Kits
      • Proteins
      • Antibodies
      • Flow Cytometry
      • Assay Kits
      • Molecular Biology
      • Other Products
      • Human Cytokine Array C5
      • Human IL-6 ELISA
      • Human Inflammation Array Q3
      • Mouse Cytokine Array C3
      • Recombinant SARS-CoV-2 Spike Protein, S1 Subunit
      • Human Phosphorylation Pathway Profiling Array C55
      • Antibody Arrays
      • Proteome Profiling Arrays
      • Cytometric Bead Arrays
      • Epitope Mapping Peptide Arrays
      • Protein Arrays
      • PTM Multiplex Assays
      • NexaTag® Ultrasensitive Multiplex ELISA
      • Sandwich ELISA
      • Competitive ELISA
      • PTM ELISA
      • NexaTag® Ultrasensitive qIPCR ELISA
      • Indirect ELISA
      • Bridging ELISA
      • Cell-Based ELISA
      • Recombinant Proteins
      • GMP Proteins
      • Native Proteins
      • Peptides
      • Primary Antibodies
      • Secondary Antibodies
      • Flow Cytometry Antibodies
      • Isotype Controls
      • Antibody Pairs
      • Flow Cytometry Antibodies
      • Flow Cytometry Reagents
      • Flow Cytometry Assays
      • Cytometric Bead Arrays
      • Fluorescent Beads
      • Quantum Dots
      • Metabolism Assays
      • Ligand Binding Assays
      • Drug Antibody (DA) & ADA Assays
      • Transcription Factor Activity Assays
      • PCR Assays
      • Nucleic Acid Assays
      • Epigenetics
      • Mitochondrial Assays
      • Reagents
      • Cell Culture
      • Biospecimen Samples
      • Sample Collection & Preparation
      • Lysates
      • Magnetic Beads
      • Lab Equipment and Supplies
      • Biological Buffers

      Featured Products

      Human Cytokine Array C5Human IL-6 ELISAHuman Inflammation Array Q3Mouse Cytokine Array C3Recombinant SARS-CoV-2 Spike Protein, S1 SubunitHuman Phosphorylation Pathway Profiling Array C55
    • Services
      • Multiplex Assay Services
      • ELISA Services
      • Protein Services
      • Antibody Services
      • CRO Services
      • Flow Cytometry Services
      • SIMOA – Single Molecule Array
      • Other Services
      • Quantitative Proteomics Services
      • Discovery Proteomics Services
      • Custom Arrays
      • Array Scanning and Analysis
      • Custom Protein Production
      • GMP Protein Production
      • IHC Controls
      • Stable Cell Line Development
      • Molecular Biology Services
      • Antibody Production
      • Recombinant Antibody Expression
      • Bulk Antibody Production
      • Antibody Conjugation Services
      • Cell Biology Services
      • Epitope Mapping Services
      • Biomarker Discovery
      • Cell Biology Services
      • Antibody Drug Development & Characterization
      • Pharmacokinetic and Pharmacodynamic Analysis
      • Assay Development Services
      • Molecular Biology Services
      • Multiomics Services
      • Diagnostic Assay Development
      • GMP Protein Production
      • Biostatistics and Bioinformatics
      • Bulk Antibody Production
      • QC Testing Services
      • Auto-Western Blot Service
      • COVID-19 Pseudovirus Service
      • Biospecimen Samples & Sample Services
      • RNA & DNA Methylation Detection Services
    • Research Areas
      • Cell Signaling Pathways
      • Areas of Interest
      • Akt Signaling Pathway
      • AMPK Signaling pathway
      • ErbB Signaling Pathway
      • Hedgehog Signaling Pathway
      • HIF1-alpha Signaling Pathway
      • IGFR1 Signaling Pathway
      • JAK-STAT Signaling Pathway
      • MAPK Signaling Pathway
      • mTOR Signaling Pathway
      • NF-kappaB Signaling Pathway
      • Notch Signaling Pathway
      • p53 Signaling Pathway
      • PKC Pathway
      • TGF-beta Signaling Pathway
      • Wnt/beta-Catenin Pathway
      • Antibody Drug Development
      • Autoimmunity & Inflammation
      • Cancer
      • Cardiovascular Disease
      • Infectious Disease & Vaccines
      • Neuroscience
      • Obesity
      • Post Translational Modifications
      • RNA & DNA Modifications
    • Resources
      • Array Picker Tool
      • Sample Shipment Instructions
      • Sample Preparation Tips
      • Publications / Citations
      • Promotions
      • Resource Library
      • Learning Center
      • Manual Protocols
      • Array Analysis Tools
    • Contact Us
      • Distributors & Service Providers
    • About Us
      • Quality Systems
      • Business Partnerships
      • Careers
      • News & Events