Hierarchical Clustering
What is it? Hierarchical clustering characterizes how similar (or dissimilar) the samples are based on overall patterns of measurements. For example, the groups may be patients and the overall patterns may be derived from the protein expression across numerous proteins. Hierarchical clustering analyzes the similarity in a binary fashion starting from one sample.
When is it used? This test is performed to stratify samples. You cannot dictate how many clusters are made.
Hierarchical Clustering: Example Questions
How similar are cell lines X, Y, and Z based on their expression profile?
How many subsets of breast cancer are there based on the expression profile?
Is the expression profile of a treated patient more similar to a healthy patient or a diseased patient?
How does it work? Hierarchical clustering uses an algorithm to create a cluster dendogram, which shows how groups cluster with each other (Figure 1). Using the example given in Figure 1, the steps of creating a hierarchical cluster are:
- The protein expression for each protein across 8 patients is centered and then "scaled" by taking into account the mean and standard deviation, respectively, of the expression values (Figure 2).
- The Euclidean distance, or the closest distance between two data points based on value intensity (e.g., protein response), is calculated.
- The two closest data points are clustered together, which are now treated as one data point. The next two closest data points are clustered together, etc. This continues until all data groups are "merged" into one cluster.
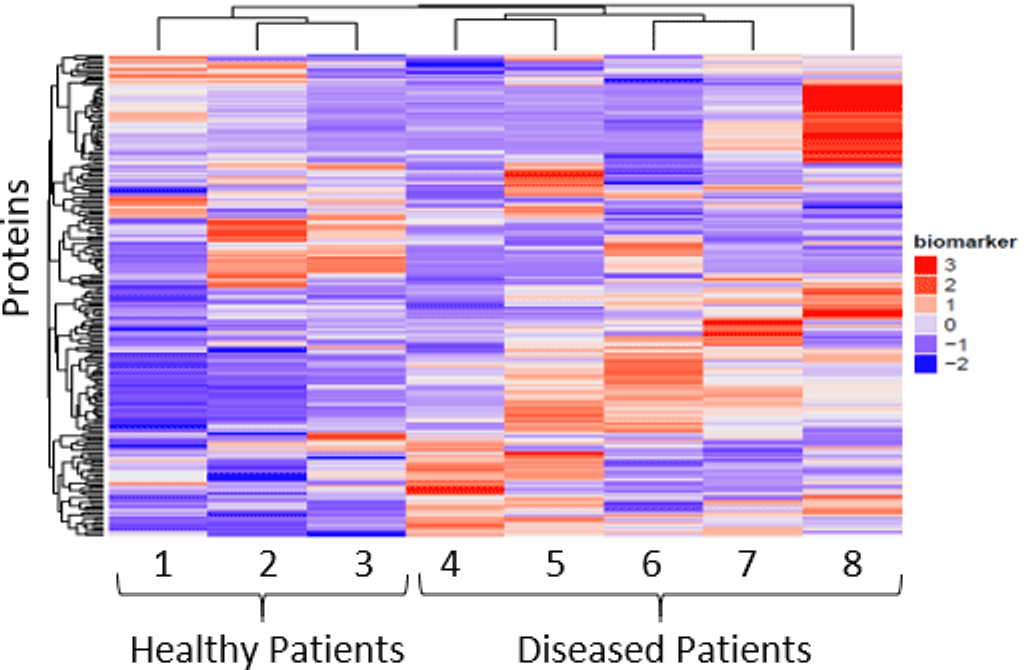
Figure 1. Hierarchical cluster of healthy and diseased patients where red respresents increased expression level and blue represents decreased expression level.
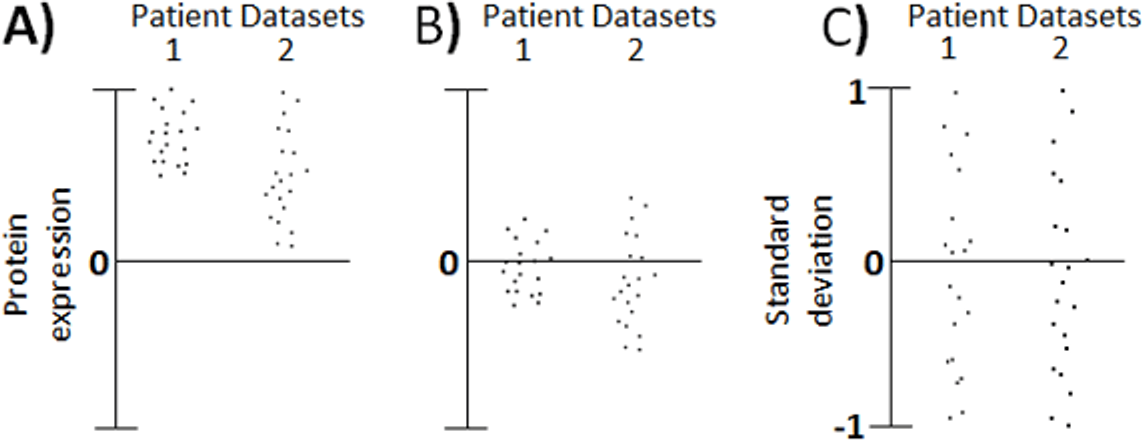
Figure 2. Example of Centering and Scaling Data. A) Expression level of Protein "X" across two datasets are B) centered and C) scaled so that all datasets have a mean of 0 and a standard deviation of 1.
What does the data look like? Hierarchical clustering produces 1) a heat map with cluster dendograms (Figure 1) and 2) a table outlining which groups cluster together (table not shown).