| Size | 2 Sample Kit, 4 Sample Kit, 8 Sample Kit |
| Estimated Lead Time | 1-2 business days |
| Species | Mouse |
| Compatible Sample Types | Cell Culture Supernatants, Plasma, Serum, Tissue Lysates, Cell Lysates |
| Quantitative/Semi-Quantitative | Semi-Quantitative |
| Number of Targets Detected | 11 |
| Solid Support | Membrane |
| Design Principle | Sandwich-based |
| Method Of Detection | Chemiluminescence |
| Research Area | Post-Translational Modifications, Phosphorylation, MAPK Signaling, mTOR Signaling, p53 Signaling, NFkB Signaling, PKC Signaling |
| Shipping Type | Blue ice |
| Storage | -20°C |
| Scroll over each target protein for more information | ||||
|---|---|---|---|---|
|
ATM (P-Ser1981)
|
eIF-2a (P-Ser52)
|
HDAC2 (P-Ser394)
|
HDAC4 (P-Ser632)
|
IKB-alpha (P-Ser32)
|
|
MSK1 (P-Ser376)
|
NF-kB (P-Ser536)
|
STAT1 (P-Ser727)
|
TAK1 (P-Ser412)
|
TBK1 (P-Ser172)
|
|
ZAP70 (P-Tyr292)
|
||||
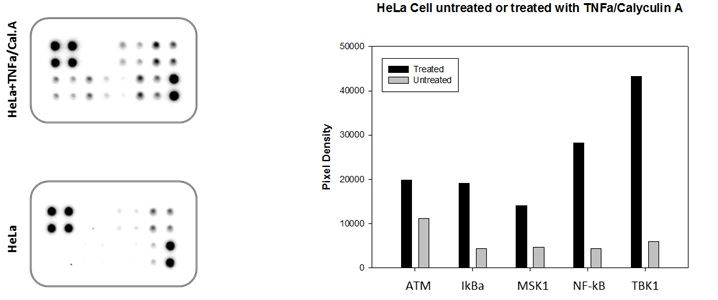
Figure 1 - HeLa cells were grown to 80% confluency and then serum starved overnight. Cells were either untreated (bottom panel) or treated (top panel) with TNF alpha and Calyculin A. Data shown are from a 20 second exposure using a chemiluminescence imaging system.
Note the strong signals of the Positive Control spots in the upper left and lower right corners. (See below for further details on the control spots.)
The signal intensity for each antigen-specific antibody spot is proportional to the relative concentration of the antigen in that sample. Comparison of signal intensities for individual antigen-specific antibody spots between and among array images can be used to determine relative differences in expression levels of each analyte sample-to-sample or group-to-group.
Your cart is empty.
Mouse NF-κB Pathway Phosphorylation Array C1