PCA Analysis
What is it? Principle Component Analysis (PCA) transforms high-dimensional data into a lower-dimensional structure to improve data presentation, pattern recognition, and analysis. PCA determines which dimensions will result in the largest variability of measurements (e.g., expression of specific proteins) across all samples. It does not separate the different groups from each other as the method is unsupervised.
When is it used? This analysis is used when 1) there are a lot of variables to consider (e.g., expression of thousands of proteins), and 2) you want to ensure that the transformed measurements are independent of each other. PCA can help discover relationships between biomarkers that may not be intuitive.
How does it work?
PCA Analysis: Example
We analyze the protein profile of 1,000 proteins of 4 healthy patients and 4 cancer patients using an antibody-based microarray. This represents high-dimensional data since each sample is characterized by 1,000 variables (or biomarkers). Put another way, the sample point is located in a 1,000 dimension space. We want to find the biomarkers that are the most variable across the samples. We hope that, by doing so, we will be able to identify patterns (i.e., biomarkers that are expressed differently in healthy and diseased patients).
- Center & scale data by subtracting the mean of each patient dataset from itself and dividing each patient dataset with its standard deviation, respectively. Now all datasets have a mean of 0 and a standard deviation of 1.
- Create Principal Components (i.e., "Data Reduction").
- Determine # of Principal Components (PCs). The number of PCs is determined by the minimum number of samples or variables. In this case, the number of patients is lower than the number of proteins analyzed, so 8 PCs are made.
- Create PCs. Here, each sample has 8 PCs, where each PC value is a weighted summation of the 1,000 variables.
- Weigh variables differently. Variables that have the largest variance across patient groups are weighted more than variables with smaller variances. Since the variables are weighted differently for each PC, the PCs are uncorrelated to each other. Now the sample point is placed in an 8-dimensional space. The PCs are ordered based on sample variability, such that the first PC (PC1) has the highest variability, PC2 has the second highest variability, and so on.
- Reduce data dimension. We plot the PCs against each other, and we can now use these plots to create new axes via data transformation (Figure 1). Thus, we reduce the space from 1,000 dimensions to 8 dimensions.
- Compare PCs visually using a scatter plot to observe patterns (Figure 2). PC1 and PC2 are usually the PCs that are plotted against each other because they result in the highest and second highest distribution variances, respectively, of all PCs. Groups that are more similar to each other will have higher overlap on the PCA plot. Therefore, group similarity or dissimilarity can be easily and visually discerned using a PCA plot.
- PCA analysis. Biomarkers making greater contributions to the PCs can be identified as they will have higher weights.

Figure 1. An example of centering and transforming PC data. A) Scatter plot of one PC versus another. B) Data is centered. C) Axes are transformed to align with the directions of maximum variance.
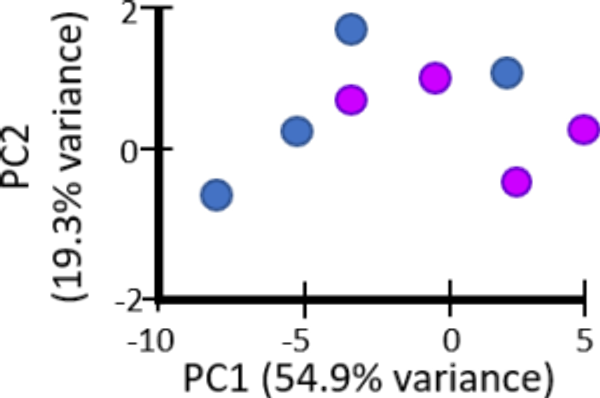
Figure 2. PCA plot of 1,000 biomarkers among 4 healthy (blue) and diseased (pink) patients. The weighted PCs separate the two groups visually along PC1 and PC2.
What does the data look like? PCA analyses are represented as 1) a figure (like Figure 2) or 2) a table listing the first few PCs. Biomarkers that were weighted the most can be considered as potential biomarkers for follow-up validation studies. Since biology is complicated and we still have a lot to learn, PCA analysis may not identify variables that are intuitive.
1 Feedback on "PCA Analysis"
- This is very helpful! Thank you for the explanation with great examples!
