
- Products
- Services
- Biomarker Discovery
- Cell Biology Services
- Antibody Drug Development & Characterization
- Pharmacokinetic and Pharmacodynamic Analysis
- Assay Development Services
- Molecular Biology Services
- Multiomics Services
- Diagnostic Assay Development
- GMP Protein Production
- Biostatistics and Bioinformatics
- Bulk Antibody Production
- QC Testing Services
- Research Areas
- Akt Signaling Pathway
- AMPK Signaling pathway
- ErbB Signaling Pathway
- Hedgehog Signaling Pathway
- HIF1-alpha Signaling Pathway
- IGFR1 Signaling Pathway
- JAK-STAT Signaling Pathway
- MAPK Signaling Pathway
- mTOR Signaling Pathway
- NF-kappaB Signaling Pathway
- Notch Signaling Pathway
- p53 Signaling Pathway
- PKC Pathway
- TGF-beta Signaling Pathway
- Wnt/beta-Catenin Pathway
- Resources
- Contact Us
- About Us
t-test & ANOVA (Analysis of Variance)
What are they? The t-test is a method that determines whether two populations are statistically different from each other, whereas ANOVA determines whether three or more populations are statistically different from each other. Both of them look at the difference in means and the spread of the distributions (i.e., variance) across groups; however, the ways that they determine the statistical significance are different.
When are they used? These tests are performed when 1) the samples are independent of each other and 2) have (approximately) normal distributions or when the sample number is high (e.g., > 30 per group). More samples are better, but the tests can be performed with as little as 3 samples per condition.
How do they work?
Same means, different variance
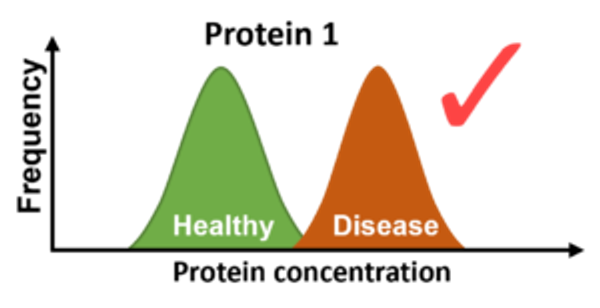
Figure 1. Overlapping histogram plots for concentrations of protein 1 in different populations.
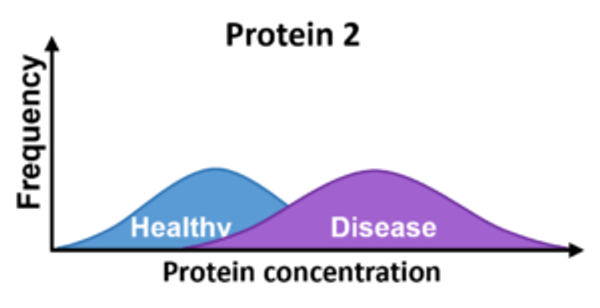
Figure 2. Overlapping histogram plots for concentrations of protein 2 in different populations.
Same means, different variance
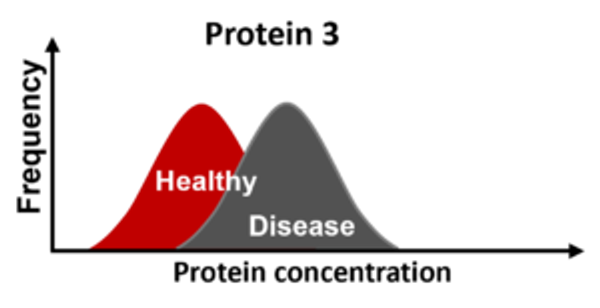
Figure 3. Overlapping histogram plots for concentrations of protein 3 in different populations.
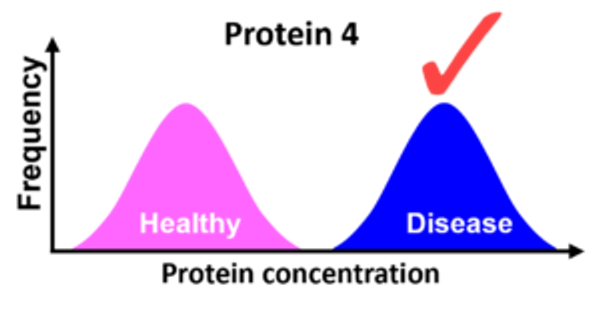
Figure 4. Overlapping histogram plots for concentrations of protein 4 in different populations.
t-test Example
We want to determine whether the concentration of Proteins 1 – 4 in serum are significantly different between healthy and diseased patients. A t-test is performed, which can be visually explained by plotting the protein concentration on the X-axis and the frequency along the Y-axis of the two proteins on the same graph (Figures 1 - 4).
Proteins 1 & 2 have the same difference in protein concentration means but different group variances. Alternatively, Proteins 3 & 4 have similar variances but Protein 4 has a larger difference in protein concentration means between the patient groups.
A t-test assigns a "t" test statistic value to each biomarker. A good differential biomarker, represented by little to no overlap of the distributions and a large difference in means, would have a high "t" value.
Which is a better biomarker of disease: Protein 1 or Protein 2?
Protein 1
Which is a better biomarker of disease: Protein 3 or Protein 4?
Protein 4
What type of statistical value do I get? The t-test and ANOVA produce a test statistic value ("t" or "F", respectively), which is converted into a "p-value." A p-value is the probability that the null hypothesis – that both (or all) populations are the same – is true. In other words, a lower p-value reflects a value that is more significantly different across populations. Biomarkers with significant differences between sample populations have p-values ≤ 0.05.
190 Feedbacks on "t-test & ANOVA (Analysis of Variance)"

Erika Pearson
April 16 2024 at 3:32 amWhat statistical test would be most appropriate to test the claim that the mean weight of individuals prior to a new diet is higher that their weight subsequent to the diet?jn3210315
December 18 2023 at 10:28 pmI’m doing my bachelors level research in which I have one independent and two dependent variables. I’m seeing the impact of the independent variable on the two dependent variables separately. The two dependent variables have no connection with each other. The participants for the study are 60 and are not grouped. Which test would be recommended for it?James435
December 8 2023 at 7:39 amI believe it is a trick for observation and you should display eliminated answers.