Skip to navigationSkip to contentSkip to footer
Need Help?770-729-2992
MY ACCOUNT
CART
RayBiotech
RayBiotech
  • Products
    • Multiplex Assays
    • ELISA Kits
    • Proteins
    • Antibodies
    • Flow Cytometry
    • Assay Kits
    • Molecular Biology
    • Other Products
    • Human Cytokine Array C5
    • Human IL-6 ELISA
    • Human Inflammation Array Q3
    • Mouse Cytokine Array C3
    • Recombinant SARS-CoV-2 Spike Protein, S1 Subunit
    • Human Phosphorylation Pathway Profiling Array C55
    • Antibody Arrays
    • Proteome Profiling Arrays
    • Cytometric Bead Arrays
    • Epitope Mapping Peptide Arrays
    • Protein Arrays
    • PTM Multiplex Assays
    • NexaTag® Ultrasensitive Multiplex ELISA
    • Sandwich ELISA
    • Competitive ELISA
    • PTM ELISA
    • NexaTag® Ultrasensitive qIPCR ELISA
    • Indirect ELISA
    • Bridging ELISA
    • Cell-Based ELISA
    • Recombinant Proteins
    • GMP Proteins
    • Native Proteins
    • Peptides
    • Primary Antibodies
    • Secondary Antibodies
    • Flow Cytometry Antibodies
    • Isotype Controls
    • Antibody Pairs
    • Flow Cytometry Antibodies
    • Flow Cytometry Reagents
    • Flow Cytometry Assays
    • Cytometric Bead Arrays
    • Fluorescent Beads
    • Quantum Dots
    • Metabolism Assays
    • Ligand Binding Assays
    • Drug Antibody (DA) & ADA Assays
    • Transcription Factor Activity Assays
    • PCR Assays
    • Nucleic Acid Assays
    • Epigenetics
    • Mitochondrial Assays
    • Reagents
    • Cell Culture
    • Biospecimen Samples
    • Sample Collection & Preparation
    • Lysates
    • Mass Spectometry Reagents
    • Magnetic Beads
    • Lab Equipment and Supplies
    • Biological Buffers

    Featured Products

    Human Cytokine Array C5Human IL-6 ELISAHuman Inflammation Array Q3Mouse Cytokine Array C3Recombinant SARS-CoV-2 Spike Protein, S1 SubunitHuman Phosphorylation Pathway Profiling Array C55
  • Services
    • Multiplex Assay Services
    • ELISA Services
    • Protein Services
    • Antibody Services
    • CRO Services
    • Flow Cytometry Services
    • SIMOA – Single Molecule Array
    • Other Services
    • Quantitative Proteomics Services
    • Discovery Proteomics Services
    • Custom Arrays
    • Array Scanning and Analysis
    • Custom Protein Production
    • GMP Protein Production
    • IHC Controls
    • Stable Cell Line Development
    • Molecular Biology Services
    • Antibody Production
    • Recombinant Antibody Expression
    • Bulk Antibody Production
    • Antibody Conjugation Services
    • Cell Biology Services
    • Epitope Mapping Services
    • Biomarker Discovery
    • Cell Biology Services
    • Antibody Drug Development & Characterization
    • Pharmacokinetic and Pharmacodynamic Analysis
    • Assay Development Services
    • Molecular Biology Services
    • Multiomics Services
    • Diagnostic Assay Development
    • GMP Protein Production
    • Biostatistics and Bioinformatics
    • Bulk Antibody Production
    • QC Testing Services
    • Auto-Western Blot Service
    • COVID-19 Pseudovirus Service
    • Biospecimen Samples & Sample Services
    • RNA & DNA Methylation Detection Services
  • Research Areas
    • Cell Signaling Pathways
    • Areas of Interest
    • Akt Signaling Pathway
    • AMPK Signaling pathway
    • ErbB Signaling Pathway
    • Hedgehog Signaling Pathway
    • HIF1-alpha Signaling Pathway
    • IGFR1 Signaling Pathway
    • JAK-STAT Signaling Pathway
    • MAPK Signaling Pathway
    • mTOR Signaling Pathway
    • NF-kappaB Signaling Pathway
    • Notch Signaling Pathway
    • p53 Signaling Pathway
    • PKC Pathway
    • TGF-beta Signaling Pathway
    • Wnt/beta-Catenin Pathway
    • Antibody Drug Development
    • Autoimmunity & Inflammation
    • Cancer
    • Cardiovascular Disease
    • Infectious Disease & Vaccines
    • Neuroscience
    • Obesity
    • Post Translational Modifications
    • RNA & DNA Modifications
  • Resources
    • Assay Picker Tool
    • Sample Shipment Instructions
    • Sample Preparation Tips
    • Publications / Citations
    • Promotions
    • Resource Library
    • Learning Center
    • Manual Protocols
    • Array Analysis Tools
  • Contact Us
    • Distributors & Service Providers
  • About Us
    • Quality Systems
    • Business Partnerships
    • Careers
    • News & Events
Products
  • Multiplex Assays
  • ELISA Kits
  • Proteins and Peptides
  • Antibodies
  • Flow Cytometry
  • Assay Kits
  • Molecular Biology

Sign up to get promotions on your favorite research tools and research updates.

Sign up to Newsletter (opens in new tab)
Services
  • Multiplex Assay Services
  • ELISA Services
  • Antibody Services
  • Custom Protein Services
  • CRO Services
  • Flow Cytometry Services
  • Simoa – Single Molecule Array Services
Resources
  • Manual Protocols
  • Resource Library
  • Learning Center
  • Array Analysis Tools
  • Publications / Citations
  • Publications by RayBiotech Scientists
About Us
  • About RayBiotech
  • Careers
  • Quality Systems
  • Business Partnerships
  • News & Events
  • Reducing Our Emissions
Contact Us
  • Contacts
  • Distributors
  • Certified Service Providers
ISO 13485:2016cGMP
ISO 17025:2017CLIA
©2007-2026 RayBiotech, Inc. All rights reserved.Life Science Web Design By Supreme
  • Privacy Policy
  • Terms & Conditions
  • ISO Certification
  • Risk Free Guarantee
  • Promotions

Your cart is empty.

  • Home
  • Learning Center
  • Biostatistics & Bioinformatics
  • Wilcoxon Rank-Sum
November 21, 2018|Biostatistics & Bioinformatics|Valerie Jones, PhD

Wilcoxon Rank-Sum

What is it? The Wilcoxon Rank-Sum is a method that determines whether two populations are statistically different from each other based on ranks rather than the original values of the measurements. In other words, it ranks all values to determine whether the values are or are not evenly distributed across both populations.

When is it used? This test is performed when 1) the samples are independent of each other and 2) are or are not normally distributed.

How does it work?

Wilcoxon Rank-Sum Example

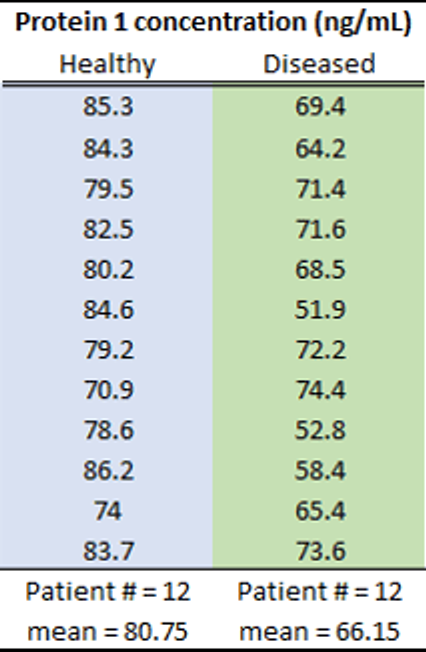
We want to determine whether the concentration of Protein 1 in serum is significantly different between healthy and diseased patients. We first collect data for healthy and diseased patients (Figure 1).

  1. Wilcoxon Rank-Sum then ranks the values, and assigns the rank to the values (Figure 2). The average ranks from the groups are determined; these averages will be close if there is no difference between the groups.
  2. The rank mean of one group is compared to the overall rank mean to determine a test statistic called a z-score. If the groups are evenly distributed, then the z-score will be closer to 0. In this case, the z-score is 3.81, which is equal to a p-value < 0.001. (A p-value of ~0.05 is approximately equal to a z-score of 2.5.)

Is Protein 1 a potential biomarker of disease? Yes, the concentration of Protein 1 in healthy and diseased patients is very different from each other, which is indicated by a very low p-value.
Wilcoxon Figure 1 — Collected protein concentration data

Figure 1. Collected protein concentration data for healthy (blue) and diseased (green) patients.

Wilcoxon Figure 2 — Ranked protein concentrations

Leave a Reply

Figure 2. Ranked protein concentrations from high to low collected for healthy (blue) and diseased (green) patients. The average concentration of Protein 1 in the healthy patient is clearly higher than the average concentration of Protein 1 in the diseased patient.

What does the data look like? Wilcoxon Rank-Sum produces a test statistic value (i.e., z-score), which is converted into a "p-value." A p-value is the probability that the null hypothesis - that both populations are the same - is true. In other words, a lower p-value reflects a value that is more significantly different across populations. Biomarkers with significant differences between sample populations have p-values ≤ 0.05.