5 Steps for Writing a Research Paper

Introduction
Publications are the cornerstone of science. They disseminate data that expand our understanding of the world around us (and beyond!) and help secure funding for additional studies. However, most manuscripts do not pass the journal’s initial editorial process. Here, we review the editorial process and provide 5 steps for writing a research paper that will improve its chances of being published.

Figure 1. Publications are an important tool to disseminate research findings.
Editorial Process
Once a manuscript is submitted to a journal, it undergoes a multi-tier editorial process that includes the technical editor, chief editor, and associate editor before it is even sent out for review. The technical editor is the first one who reviews incoming manuscripts (Figure 2). Their primary duty is to ensure that the manuscript adheres to the journal’s specific requirements, such as the number of words and figure resolution. If the manuscript meets these requirements, it will next be reviewed by the chief editor, who reads the abstract – and only the abstract – to determine if the research paper is a good fit for the journal. Manuscripts that pass this stage continue to the associate editor who will read the entire manuscript. Only manuscripts that are deemed good enough will be sent out to two to three reviewers, who may or may not recommend the research paper for publication.
Research Scientists
Submits manuscript
Technical Editor
Checks word number and figure resolution
Chief Editor
Reads abstract; determines if the paper is a good fit for the journal
Associate Editor
Reads whole paper; determines if paper is good enough to be sent out for review
Reviewers
2 - 3 experts in the field
Figure 2. Overview of the initial editorial process at scientific journals.
Step 1: Select a realistic journal
Selecting an appropriate and realistic journal is one of the most important decisions in improving your chances of getting your research paper published. To do this, read papers published by your journal-of-interest. Your envisioned paper in terms of potential impact, research topic, and amount of data should be comparable to other papers in that journal. To help narrow down the list of candidate journals to consider, try focusing on the journals that you read.
Step 2: Determine journal requirements
Each journal will have its own set of requirements, from word limits to formatting references. Failure to follow the journal’s requirements will result in the technical editor sending your manuscript back to you. These guidelines often address:
- Word limits
- Formatting for section headings
- Formatting for references
- Number of figures, tables, and references
- Resolution of images
Formatting references to the correct style can be easily performed by software like EndNote.
Step 3: Collect enough data
Collect or continue to collect data for your study until the amount of data required for your target journal is met. Drafting a list of the tables and figures – and even the figure legends – before you even start your experiment can help streamline your data collection process. To perform statistical analyses, the number of replicates per group should be at least 3 – 5. Some analyses require more replicates, so it is important to seek the advice of a biostatistician before starting your experiment. You can also perform a statistical Power Analysis to determine the required sample size to detect an effect with a given degree of confidence.
Do you need help with experimental design, data collection, or data analysis? RayBiotech is a contract research organization that offers a comprehensive range of full testing services for proteomics research, including protein profiling with antibody arrays and biostatistics and bioinformatics analyses.
Step 4: Make high quality figures
Figures should be high quality with a minimum resolution of 300 dots per inch (dpi). Between the figure image and legend, the reader should be able to understand how the data were obtained without having to refer to the body text. With that said, if an acronym is described in the body text, it does not need to be described again in the legend. Each figure legend should have this structure:
- Title: Figure conclusion
- Sub-figure legend: Describe the data, but don’t interpret what the data mean. A sub-figure legend typically includes the analysis or assay method, what was measured, the sample type, full name of the treatment and concentration, and the length of treatment.
- Last sentence: Include the statistical test used, what the p-values represent, and the number of replicates (e.g., n=5)
An example of a figure legend1 that follows the guidelines above is below:
Figure 6. LGG supplementation decreases colonic tumor burden in a genetic cancer model. (A) Intestinal specific MSH2 knockout mice were generated by crossing Villin-Cremice with MSH2loxPuntil homozygosity. Intestinal specific MSH2 knockout mice were raised to 7 months of age, whereupon the were supplemented with HBSS, LGG, or BC by oral gavage for 6 weeks. After 6 weeks of supplementation, quantification of tumor burden was determined following removal and opening the colon longitudinally. (B) Colon lengths of mice described in (A) measured from rectum to cecum before removing colonic contents or any other manipulation. (C)Hematoxylin and Eosin (H&E) sections of swiss-rolled colonic tissue with representative images of low-powered (Upper Panels) and high-powered view (Lower Panels). Areas within lower panels indicated by rectangle within the upper panels. (D) Weights of Mesenteric lymph nodes (mLn) in mice described in (A). (E) Flow cytometry analysis for the detection total CD8 T-cell numbers in mLnof mice described in (A). (F) Quantification of total effector CD8 T-cells from samples described in (E). (G) Immunofluorescence analysis for the detection of CD8 T-cells (green) DNA (Blue) within colonic polyps at 14 weeks of mice described in (A). (H) Quantification of CD8 T-cells (green) within colonic polyps at 14 weeks of mice described in (F). One-Way ANOVA utilized for statistics and represented as *=p<.05, **=p<.01, ***=p<.001. n= 9/9/8/10 for HBSS-Isotype, LGG-Isotype, HBSS-anti-CD8, and LGG-anti-CD8 respectively.
Typically, figures will show data in different ways. For example, the first sub-figure may present antibody array data as a heatmap or volcano plot, while other sub-figures may include a bar graph representing data from an enzyme-linked immunosorbent assay (ELISA) to confirm the finding and a confocal image of an immunofluorescent analysis showing the cellular distribution of a protein.
Journals with higher impact factors are now requiring that bar graphs also include data points representing each replicate (Figure 3). Such figures, as well as many others, can be produced using software like GraphPad Prism, which was built specifically for scientists to analyze and graph biological data. Adobe Photoshop can produce high resolution images and help compile multiple component figures.
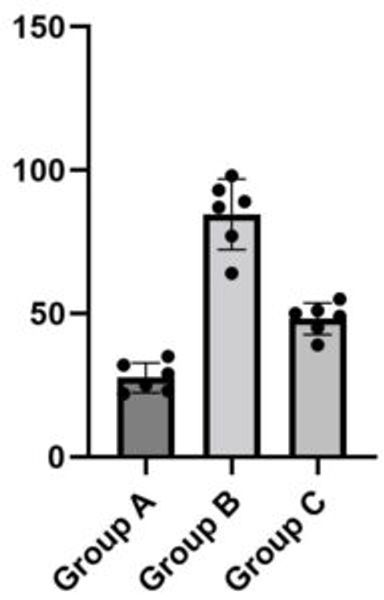
Figure 3. Bar graph generated by GraphPad Prism software with fictional data and one-way analysis of variance (ANOVA). Figures with data points representing each replicate is an important detail to include while writing a research paper for publication.
Step 5: Write a compelling story
Abstract
Surprisingly, the Abstract is often written last even though it’s the first thing your audience – and the only part of your manuscript that the chief editor – will read. Because of this, it is important to write a compelling abstract to spark your reader’s interest. A framework for writing a concise and impactful abstract is provided below:
- Introduction (2 sentences): The first sentence should be a broad introduction to the subject so that any researcher can understand the topic. The second sentence should be more focused, providing background to the precise research question. It should be understandable to researchers in a similar or closely related field of research.
- Problem/Objective (1 sentence): Describe the question or problem that will be researched in your study. Typically, this sentence starts with “However.”
- Key Finding (1 sentence): Summarize the main result. This sentence typically begins with words like “Here we show.”
- Main Results and Conclusions (3 – 5 sentences): Outline the most significant results of the investigation that are the basis of the main conclusions. You may include a few key nuggets of data, but don’t add too many numbers. Including a sentence like “Using method X, we show that (…)” is only appropriate if the focus of the article is a new method or the method is a main part of the paper.
- Significance (1 – 2 sentences): Explain how your discoveries progress the field of research and the immediate implications. Keep the potential impact of your work accurate – overstating the significance of your work may hinder your manuscript from being published.
Introduction
The Introduction section is usually comprised of 3 – 5 paragraphs. It expands upon previously collected data to highlight the problem your study is trying to address while providing data and appropriate references to support these statements. The last paragraph of the Introduction is a brief overview of the study: the objective (1 sentence), how the study was performed (2 – 3 sentences), what the study shows (2 – 3 sentences), and the significance of the findings (1 sentence). Like the abstract, try saving data (i.e., numbers) for the Results section.
Materials and Methods
The Materials and Methods section can be written as you perform your study.
Results
After the experiment is performed, the Results section is usually the first to be written. Importantly, the figure titles should be the same as the sub-headers of the results section, and data interpretation kept to a minimum. Each paragraph often follows this structure:
- Optional: Previous Study Results (1 – 2 sentences): In some circumstances, it may be necessary to explain results from previous studies to set up the reason why you’re performing the test.
- Reason (1 sentence): State the reason why you performed the test.
- Data Description (2 – 6 sentences): Describe the referenced figures and text. A lot of numbers will be provided here.
- Data Summary (1 – 2 sentences): These types of summaries often begin with “These data show that.”
Discussion and Conclusion
The study’s “big picture” should be showcased in the Discussion section where the data are given meaning. This section is usually 3 – 7 paragraphs:
- Study Summary (1 paragraph): State what the study demonstrated.
- Data Interpretation (1 – 4 paragraphs): Address intriguing findings in your study, provide interpretations of what the data could mean, and cite previous studies that support your hypotheses.
- Study Limitations (1 paragraph): If applicable, mention any major limitations to the study so that your reader knows you’ve already considered them. Provide justifications of why there were limitations and/or possible solutions to address these concerns. The last sentence of these paragraphs usually begins with “Additional studies with” or “Further investigation using.”
- Overall Meaning (1 paragraph): Summarize what all the data taken together suggest or show.
- Conclusion (1 paragraph): The conclusions are discussed in the last paragraph of the Discussion or in its own section. The conclusions should highlight the societal implications of the work since it will be the last section that is read. Leave your research on a high note! For example, briefly describe how the data could advance how a specific disease is diagnosed or treated, or how the data could expand our understanding of a particular field.
Paying attention to detail in your writing indicates to the journal editor that you took the same care when performing your experiments, which will also improve your chances of getting your manuscript reviewed. Also, grammar counts! Ask a native English speaker or seek out a professional editing service to review the manuscript.
Summary
Getting a manuscript through the editorial process and into the hands of reviewers is a major hurdle in publishing a scientific paper. Here, we described 5 steps for writing a research paper that will improve the chances it will be reviewed: select a realistic journal, determine journal requirements, collect enough data, make high quality figures, and write a compelling story. It is important to mention that, although we focus on the editorial process here, your ultimate audience will be active scientists not editors. Writing a captivating story will attract as many readers as possible so that your research gets the exposure and attention it deserves.
Learn more about topics important in research in our other blogs: tips on sample collection, common biostatistical methods explained, 7 ways to study protein phosphorylation, and more!
References
1. Owens JA, et al. Lactobacillus rhamnosus GG Orchestrates an Antitumor Immune Response. Cellular and Molecular Gastroenterology and Hepatology (2021).
2 Feedbacks on "5 Steps for Writing a Research Paper"

Marcus Hellwig
September 27 2021 at 5:26 amI´ll do so, thanks!Moses Akiibinu, PhD
September 24 2021 at 10:06 amVery useful.