Logistic Regression Model
What is it? Logistic regression is a classifier that uses a set of weighted measurements to predict the class (e.g., healthy, diseased) to which a sample belongs based on probability.
When is it used? This model is used when 1) we want to compare ≤ 2 different groups to each other, 2) the samples are independent from each other, 3) the populations may or may not be normally distributed, 4) the population groups are known (e.g., healthy, diseased), and 5) data transformation by other methods results in nonsensical values. It is usually used when the response is binary: yes or no, healthy or diseased, etc.
How does it work?
Logistic Regression: Example
We analyze the protein profile of 1,000 proteins of 100 healthy patients and 100 cancer patients using an antibody-based microarray. We want to identify the specific biomarkers that will predict which future patients are healthy or diseased.
- Center & scale data by subtracting the mean of each patient dataset from itself (Figure 1B) and dividing each patient dataset with its standard deviation (Figure 1C), respectively. Now all datasets have a mean of 0 and a standard deviation of 1.
- Fit the logistic model based on a subset of variables (Figure 2). This is accomplished by adding different weights to the biomarkers. The data should follow an S-shape (i.e., sigmoid function).
- Evaluate the performance of the model by ROC curve analysis (Figure 3).
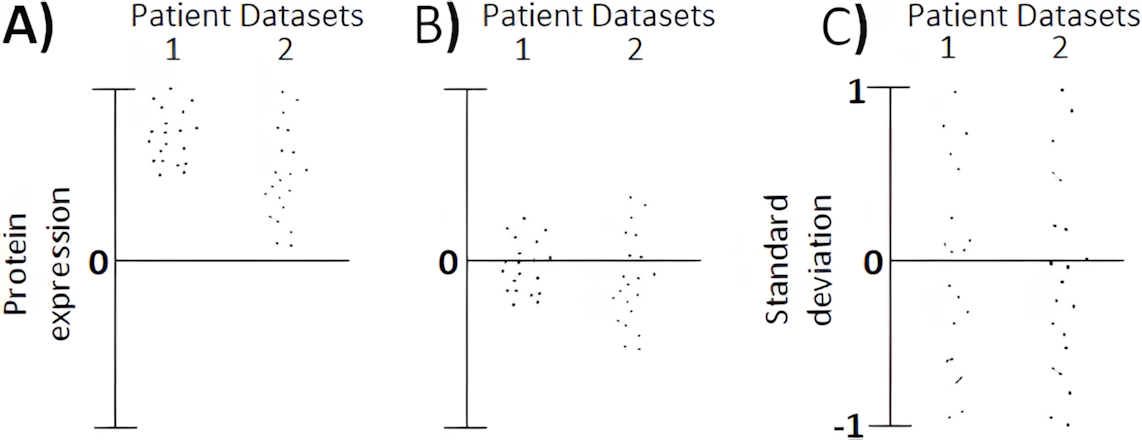
Figure 1. Example of Centering and Scaling Data. A) Expression level of Protein "X" across two datasets are B) centered and C) scaled so that all datasets have a mean of 0 and a standard deviation of 1.
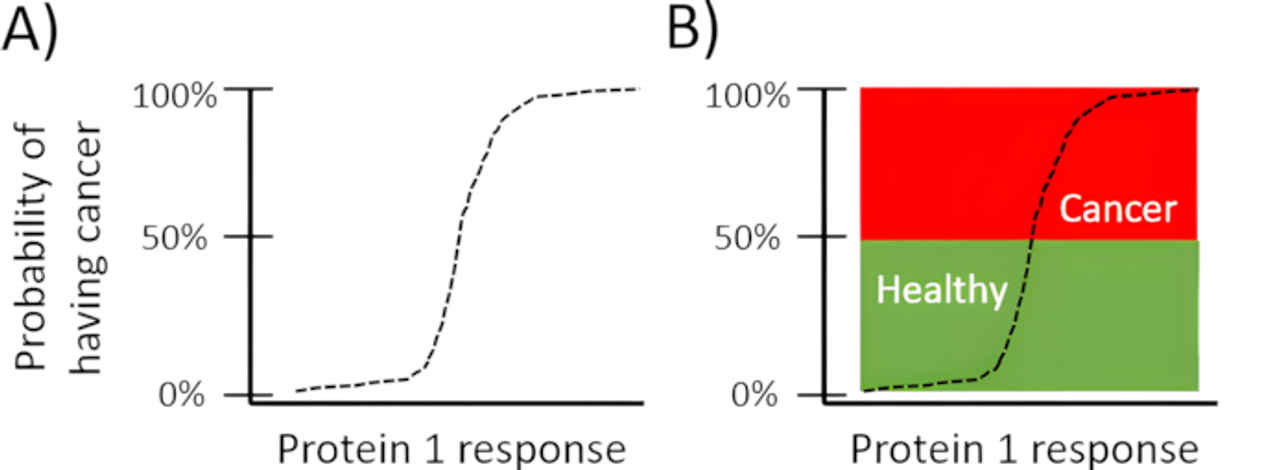
Figure 2. Protein response across all data is A) plotted and B) assigned to the patient condition (i.e., healthy, cancer). Note that the images in Figures 4 and 5 show 1 protein, but the x-axis may be a combination of proteins.
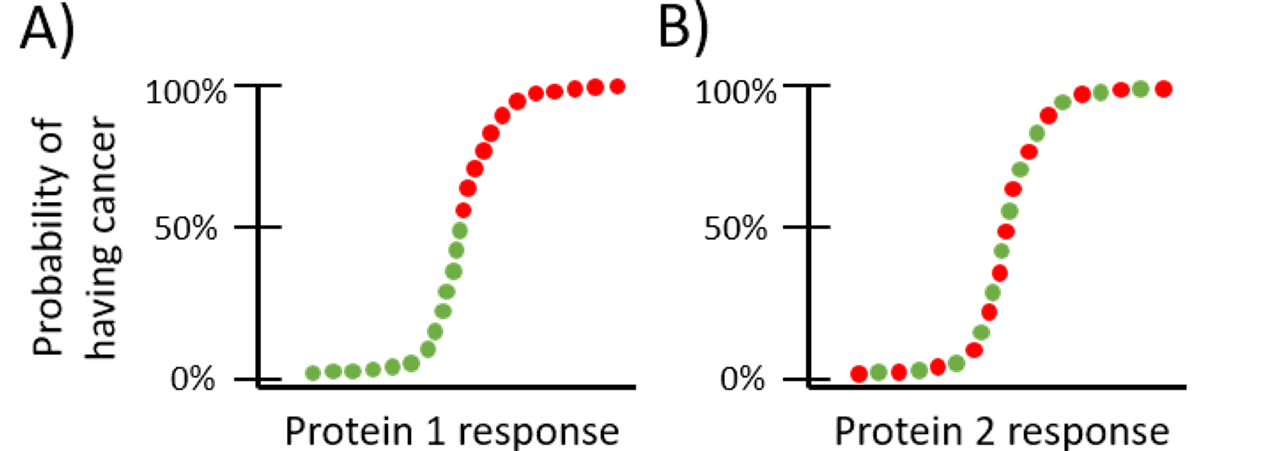
Figure 3. Examples of biomarkers with different predictive powers to determine the health condition of a patient. A) Protein 1 would be determined to be a good biomarker of cancer while B) Protein 2 would not be a good biomarker. Green = healthy; Red = cancer.
What does the data look like? The data can be presented in a table format, which would list the biomarkers and their corresponding coefficients (i.e., weights) that are used in the model. Performance of the logistic regression is evaluated by ROC curve analysis.