Skip to navigationSkip to contentSkip to footer
Need Help?770-729-2992
MY ACCOUNT
CART
RayBiotech
RayBiotech
  • Products
    • Multiplex Assays
    • ELISA Kits
    • Proteins
    • Antibodies
    • Flow Cytometry
    • Assay Kits
    • Molecular Biology
    • Other Products
    • Human Cytokine Array C5
    • Human IL-6 ELISA
    • Human Inflammation Array Q3
    • Mouse Cytokine Array C3
    • Recombinant SARS-CoV-2 Spike Protein, S1 Subunit
    • Human Phosphorylation Pathway Profiling Array C55
    • Antibody Arrays
    • Proteome Profiling Arrays
    • Cytometric Bead Arrays
    • Epitope Mapping Peptide Arrays
    • Protein Arrays
    • PTM Multiplex Assays
    • NexaTag® Ultrasensitive Multiplex ELISA
    • Sandwich ELISA
    • Competitive ELISA
    • PTM ELISA
    • NexaTag® Ultrasensitive qIPCR ELISA
    • Indirect ELISA
    • Bridging ELISA
    • Cell-Based ELISA
    • Recombinant Proteins
    • GMP Proteins
    • Native Proteins
    • Peptides
    • Primary Antibodies
    • Secondary Antibodies
    • Flow Cytometry Antibodies
    • Isotype Controls
    • Antibody Pairs
    • Flow Cytometry Antibodies
    • Flow Cytometry Reagents
    • Flow Cytometry Assays
    • Cytometric Bead Arrays
    • Fluorescent Beads
    • Quantum Dots
    • Metabolism Assays
    • Ligand Binding Assays
    • Drug Antibody (DA) & ADA Assays
    • Transcription Factor Activity Assays
    • PCR Assays
    • Nucleic Acid Assays
    • Epigenetics
    • Mitochondrial Assays
    • Reagents
    • Cell Culture
    • Biospecimen Samples
    • Sample Collection & Preparation
    • Lysates
    • Magnetic Beads
    • Lab Equipment and Supplies
    • Biological Buffers

    Featured Products

    Human Cytokine Array C5Human IL-6 ELISAHuman Inflammation Array Q3Mouse Cytokine Array C3Recombinant SARS-CoV-2 Spike Protein, S1 SubunitHuman Phosphorylation Pathway Profiling Array C55
  • Services
    • Multiplex Assay Services
    • ELISA Services
    • Protein Services
    • Antibody Services
    • CRO Services
    • Flow Cytometry Services
    • SIMOA – Single Molecule Array
    • Other Services
    • Quantitative Proteomics Services
    • Discovery Proteomics Services
    • Custom Arrays
    • Array Scanning and Analysis
    • Custom Protein Production
    • GMP Protein Production
    • IHC Controls
    • Stable Cell Line Development
    • Molecular Biology Services
    • Antibody Production
    • Recombinant Antibody Expression
    • Bulk Antibody Production
    • Antibody Conjugation Services
    • Cell Biology Services
    • Epitope Mapping Services
    • Biomarker Discovery
    • Cell Biology Services
    • Antibody Drug Development & Characterization
    • Pharmacokinetic and Pharmacodynamic Analysis
    • Assay Development Services
    • Molecular Biology Services
    • Multiomics Services
    • Diagnostic Assay Development
    • GMP Protein Production
    • Biostatistics and Bioinformatics
    • Bulk Antibody Production
    • QC Testing Services
    • Auto-Western Blot Service
    • COVID-19 Pseudovirus Service
    • Biospecimen Samples & Sample Services
    • RNA & DNA Methylation Detection Services
  • Research Areas
    • Cell Signaling Pathways
    • Areas of Interest
    • Akt Signaling Pathway
    • AMPK Signaling pathway
    • ErbB Signaling Pathway
    • Hedgehog Signaling Pathway
    • HIF1-alpha Signaling Pathway
    • IGFR1 Signaling Pathway
    • JAK-STAT Signaling Pathway
    • MAPK Signaling Pathway
    • mTOR Signaling Pathway
    • NF-kappaB Signaling Pathway
    • Notch Signaling Pathway
    • p53 Signaling Pathway
    • PKC Pathway
    • TGF-beta Signaling Pathway
    • Wnt/beta-Catenin Pathway
    • Antibody Drug Development
    • Autoimmunity & Inflammation
    • Cancer
    • Cardiovascular Disease
    • Infectious Disease & Vaccines
    • Neuroscience
    • Obesity
    • Post Translational Modifications
    • RNA & DNA Modifications
  • Resources
    • Array Picker Tool
    • Sample Shipment Instructions
    • Sample Preparation Tips
    • Publications / Citations
    • Promotions
    • Resource Library
    • Learning Center
    • Manual Protocols
    • Array Analysis Tools
  • Contact Us
    • Distributors & Service Providers
  • About Us
    • Quality Systems
    • Business Partnerships
    • Careers
    • News & Events
Products
  • Multiplex Assays
  • ELISA Kits
  • Proteins and Peptides
  • Antibodies
  • Flow Cytometry
  • Assay Kits
  • Molecular Biology

Sign up to get promotions on your favorite research tools and research updates.

Sign up to Newsletter (opens in new tab)
Services
  • Multiplex Assay Services
  • ELISA Services
  • Antibody Services
  • Custom Protein Services
  • CRO Services
  • Flow Cytometry Services
  • Simoa – Single Molecule Array Services
Resources
  • Manual Protocols
  • Resource Library
  • Learning Center
  • Array Analysis Tools
  • Publications / Citations
  • Publications by RayBiotech Scientists
About Us
  • About RayBiotech
  • Careers
  • Quality Systems
  • Business Partnerships
  • News & Events
  • Reducing Our Emissions
Contact Us
  • Contacts
  • Distributors
  • Certified Service Providers
ISO 13485:2016cGMP
ISO 17025:2017CLIA
©2007-2026 RayBiotech, Inc. All rights reserved.Life Science Web Design By Supreme
  • Privacy Policy
  • Terms & Conditions
  • ISO Certification
  • Risk Free Guarantee
  • Promotions

Your cart is empty.

  • Home
  • Learning Center
  • Biostatistics & Bioinformatics
  • ROC Curve Analysis
November 21, 2018|Biostatistics & Bioinformatics|Valerie Jones, PhD

ROC Curve Analysis

What is it? A Receiver's Operating Characteristic (ROC) curve plots every value of a continuous measurement by its specificity and sensitivity to distinguish health status in a population of subjects. The area under the curve (AUC) reflects the measurement's potential to be a diagnosis tool. At a specific sensitivity, the specificity can be determined, or vice versa.

When is it used? This analysis is used to identify the appropriate classifying thresholds to diagnose a patient with expected sensitivity and specificity.

How does it work?

ROC curve analysis: Example

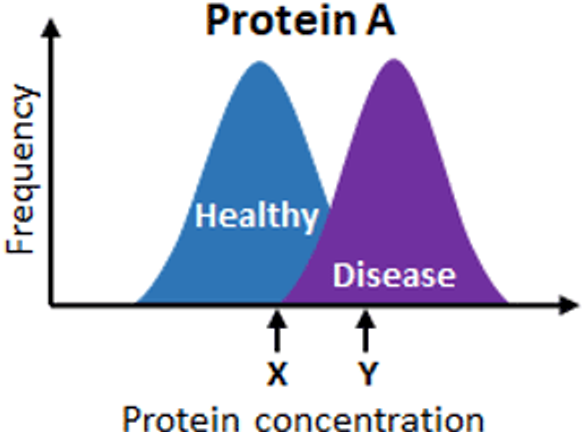
We've identified a potential biomarker, Protein "A", of Alzheimer's disease that is elevated in the plasma of Alzheimer's patients compared to healthy patients (Figure 1). We now need to determine the lower cut-off value of "Protein A" levels that will identify a patient with Alzheimer's disease. We don't want to have the threshold too low like concentration X in Figure 1 or else a lot of healthy patients will be wrongly diagnosed. However we also don't want to have a threshold that is really high like concentration Y in Figure 1 because a lot of Alzheimer's patients won't get diagnosed. A ROC curve can help identify the "sweet spot" (i.e., optimum sensitivity-specificity balance).

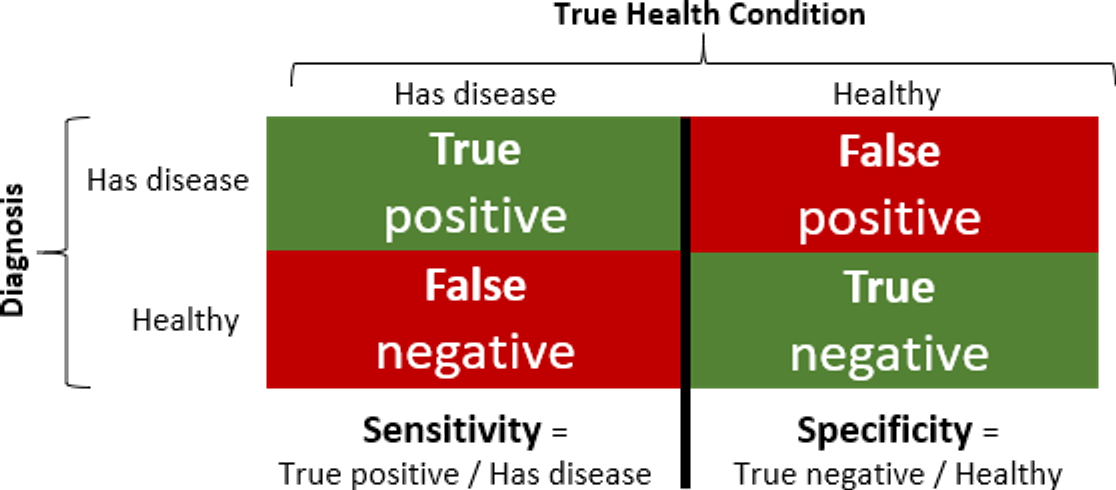
Figure 2 explains what sensitivity and specificity are. Ideally, the sensitivity and specificity would be 100%. In reality, virtually all biomarkers do not have perfect sensitivity and specificity.

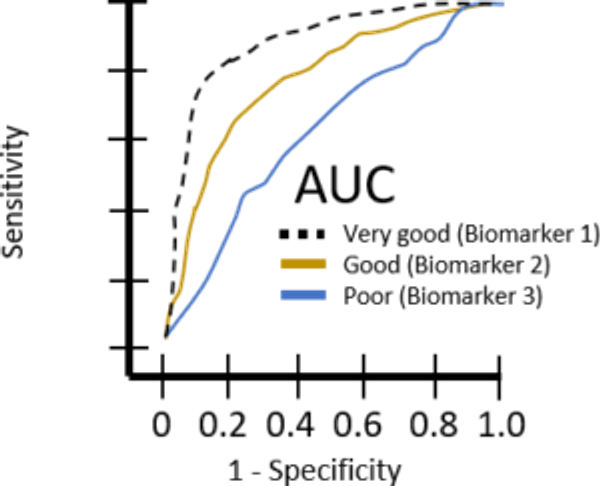
A ROC curve is generated across all values and the AUC is determined (Figure 3). Higher AUC values represent a better biomarker. A point along the ROC curve is chosen with the desired trade-off between sensitivity and specificity. With known sensitivity and specificity, the cut-off value can be ascertained.

For this example, let's assume the black dashed line is the ROC curve for our data. We would likely choose the X-Y coordinate of 0.1, 0.8, such that the biomarker would have a specificity of 90% and a sensitivity of 80%.
ROC Figure 1 — Overlapping histograms for Protein A

Figure 1. Overlapping histogram plots for concentrations of Protein A in different populations. A cut-off of concentration "X" will have high sensitivity, but low specificity. A cut-off of concentration "Y" will have low sensitivity, but high specificity.
Leave a Reply

ROC Figure 2 — Calculation of sensitivity and specificity

Figure 2. Calculation of senstivity and specificty.
ROC Figure 3 — Comparison of ROC curves

Figure 3. Comparison of ROC curves across three potential biomarkers. The higher the AUC value, the higher predictive value of the biomarker. Biomarker 3 has very poor predictive power (AUC ~0.5) as it cannot differentiate between healthy and diseased patients at all.

What does the data look like? ROC curve analyses are usually portrayed as a plot like Figure 3.