SAM (Significance Analysis of Microarray)
What is it? SAM is a method used for large-scale gene or protein expression data like those collected with microarrays. It addresses the issue of analyzing large-scale data in which a microarray experiment of 10,000 proteins would identify 100 proteins by chance using a p-value cut-off of 0.01. Therefore, SAM applies a t-test at the individual gene or protein level to determine whether the expression pattern for that gene or protein is significant.
When is it used? This test is performed when the samples 1) may not be independent of each other and 2) are or are not normally distributed. It can help identify expression patterns that have little difference between the control and test groups but are nevertheless significant.
How does it work?
SAM Example
We want to find serological proteins that are different between 12 healthy and 12 diseased patients using an antibody-based microarray targeting 1,000 proteins.
- The observed relative difference per protein across groups is determined, which considers the mean and variance of each group (Figure 1). This step accounts for protein-specific fluctuations.
- The expected relative difference per protein across groups is determined by averaging the protein responses across numerous permutations. An example of a permutation is given in Figure 2 in which a group label (e.g., healthy, diseased) is assigned at random. These random permutations form a simulated distribution of expected relative differences (like a t-statistic). The random permutations are also used to calculate the false discovery (FDR), or the rate at which a protein will be incorrectly identified as significant.
- Plot the observed vs expected relative difference (Figure 3). This is a visual way of looking at the data.
- Identify proteins-of-interest that deviate from the diagonal line using a threshold (dashed lines in Figure 3). The threshold is determined by calculating false discovery rates (FDRs) using data from the permutations.
- Determine the statistical significance of the proteins-of-interest. Biomarkers with larger deviations between the observed (step 1) and expected (step 2) relative difference are deemed significant. In other words, the larger the deviation and lower the FDR, the higher the significance.
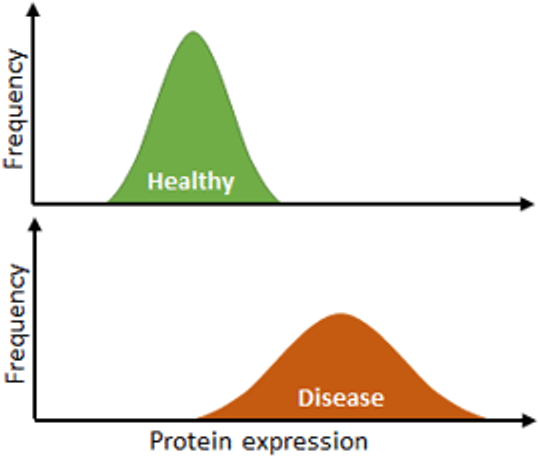
Figure 1. Histogram plots of Protein 1 expression in different populations.
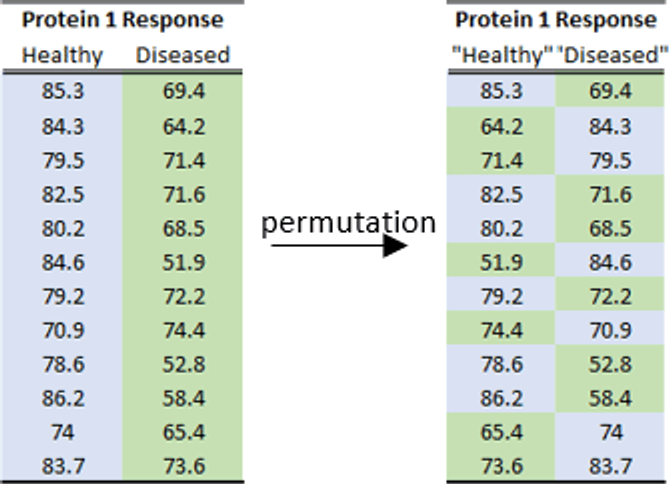
Figure 2. Permutation example for Protein 1. Note than an equal number of datasets from healthy (blue) and diseased (green) patients are being compared to each other. The "healthy" and "diseased" data sets would be compared in this permutation. Numerous permutations would be performed.
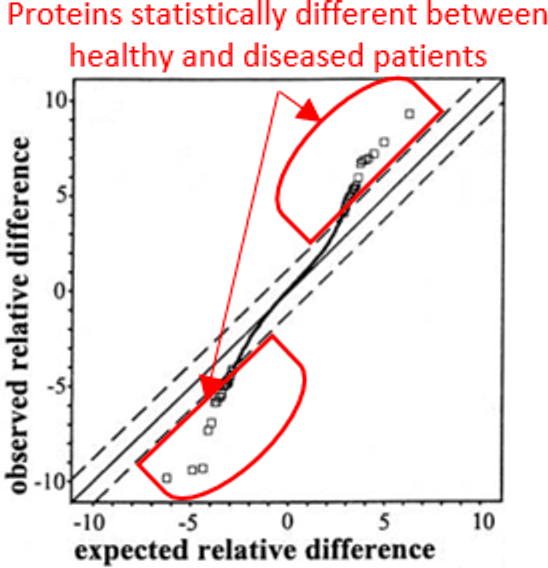
Figure 3. Scatter plot of observed vs. expected relative differences (t-statistic) of a protein. Dashed lines = threshold cut-off. Figure altered from Tusher et al. Proc Natl Acad Sci. 2001 Apr 24; 98(9): 5116-5121.
What does the data look like? For each gene or protein, SAM produces a test statistic value based upon the observed value’s deviation from the expected value. Unlike other models that use a p-value or FDR, SAM determines significance based on the deviation of the observed data from the expected value; the expected value is based on numerous permutations of the original data.