Linear Discriminant Analysis (LDA) Model
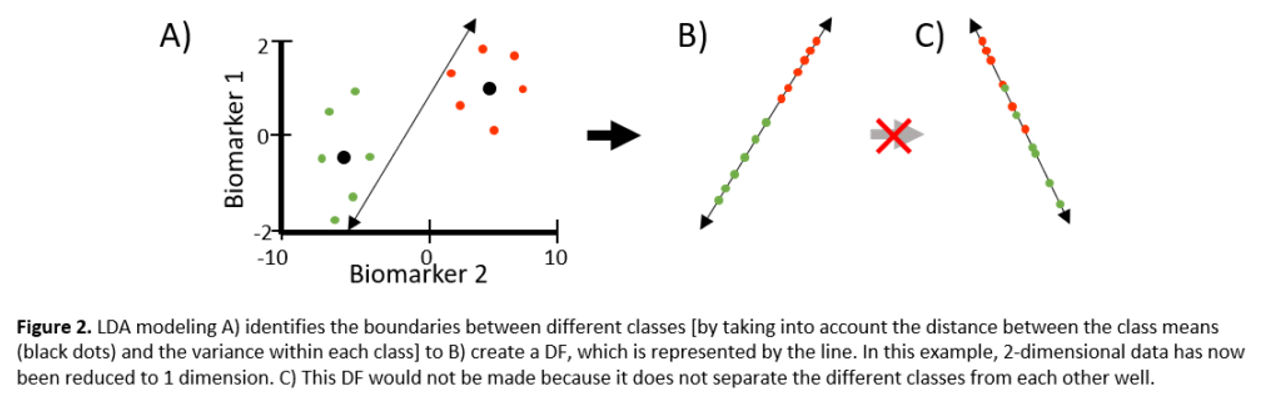
What is it? Linear discriminant analysis (LDA) separates samples into ≥ 2 classes based on the distance between class means and variance within each class. LDA can also serve to reduce data dimension.
When is it used? This analysis is used when there are a lot of variables to consider (e.g., expression of thousands of proteins). LDA makes a lot of assumptions, such as the 1) sample measurements are independent from each other, 2) distributions are normal, and 3) co-variance of the measurements are identical across different classes. Therefore, LDA will not be accurate if the data do not follow these criteria. Unlike LDA, the support vector machine (SVM) model does not assume anything about data distribution.
How does it work?
LDA Analysis: Example
We analyze the protein profile of 1,000 proteins of 100 healthy patients and 100 cancer patients using an antibody-based microarray. This represents high-dimensional data since each sample is characterized by 1,000 variables. Put another way, the sample point is located in a 1,000 dimension space. We want to find the linear discriminant function that will classify the patients as healthy or diseased.
- Assign samples to patient groups.
- Center & scale data by subtracting the mean of each patient dataset from itself and dividing each patient dataset with its standard deviation, respectively. Now all datasets have a mean of 0 and a standard deviation of 1.
- Create Discriminant Functions (i.e., "Data Reduction").
- Determine # of Discriminant Functions (DFs). The number of DFs is determined by the number of comparisons between classes (or responses). In this case, there are only 2 classes (i.e., healthy and diseased), so one DF is sufficient.
- Create DFs. Here, the DF is a function describing the linear boundary that best separates the classes based on the class means and variance within each class (Figure 2A - 2B). In other words, the DF is an equation in which the variables (i.e., biomarkers) are weighted differently.
- Visualize DF (Figure 2C).
What does the data look like? LDA analyses are represented as a table listing the weights of biomarkers per DF. LDA performance can be ascertained using ROC curve analysis.