Support Vector Machine (SVM) Model
What is it? Support vector machine (SVM) determines the boundaries that best classifies the different groups from each other using a subset of variables (e.g., biomarkers) in multi-dimensional space. The boundary is a hyperplane in which a subset of data points closest to the hyperplane (called support vectors) have the maximum distance from each other.
When is it used? This analysis is used when 1) there are multiple variables to consider (e.g., expression of thousands of proteins), and 2) regular linear transformations are not enough. Unlike linear discriminant analysis (LDA), SVM does not assume anything about data distribution.
How does it work?
SVM: Example
We analyze the protein profile of 1,000 proteins of 100 healthy patients and 100 cancer patients using an antibody-based microarray. We want to find biomarkers that will predict which future patients are healthy or diseased.
- Create a table where each row represents a protein and each column represents a patient.
- Assign groups. Here, you tell the software which samples are healthy and which have cancer.
- Center & scale data by subtracting the mean of each patient dataset from itself (Figure 1B) and dividing each patient dataset with its standard deviation (Figure 1C), respectively. Now all datasets have a mean of 0 and a standard deviation of 1.
- Fit the SVM model. This transformation finds the optimal boundary between the groups in multi-dimensional space using a subset of data points, such that the data points from different groups closest to the boundary have the maximum distance from each other (Figure 2). The appropriate number of hyperplanes is determined by cross-validation of SVM model performance.
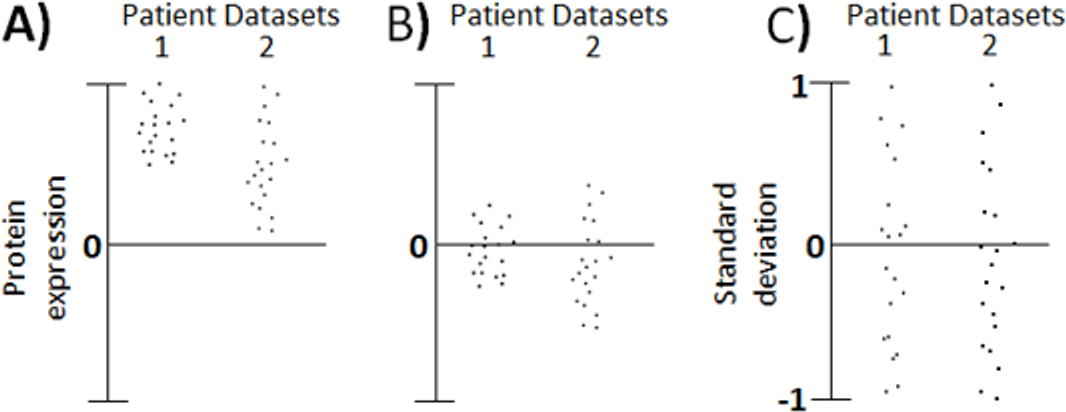
Figure 1. Patient data (A) is centered (B) and scaled (C) based on the dataset mean and standard deviation, respectively.
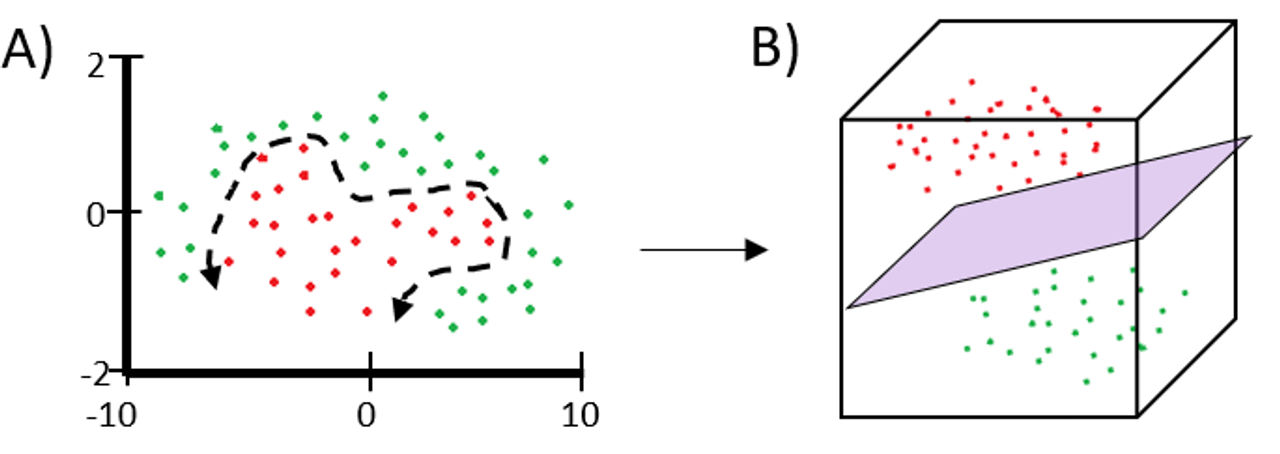
Figure 2. SVM modeling A) identifies the boundaries between groups and them B) performs complex transformation to find the hyperplane boundary between the groups in multi-dimensional space. In this example, a hyperplane was determined in 3 dimensions.
What does the data look like? The performance of the SVM model is evaluated using ROC curve analysis. Final SVM model results are represented as a table listing the selected biomarkers that classify the groups from each other.